Figures & data
Table 1. PCR primer sequences
Figure 1. Overexpression of USP3 attenuated IL-1β-mediated chondrocyte senescence.
The primary chondrocytes were transfected with USP3 over expression lentivirus or control vector virus (Vector) in the presence of recombinant IL-1β protein or vehicle. (A) Cell cycle detection using flow cytometry. (B) ROS level detection using flow cytometry. (C) Cell senescence shown by SA-β-Ga1 staining. (D) Levels of USP3, p16, p21, Cyclin E1, and CDK2 detected by Western blotting. Each data shows mean ± standard deviation from three independent biological experiments. Compared with vehicle, *p < 0.05; **p < 0.01; ***p < 0.001. And compared with IL-1β + vector, #p < 0.05; ##p < 0.01; ###p < 0.001.
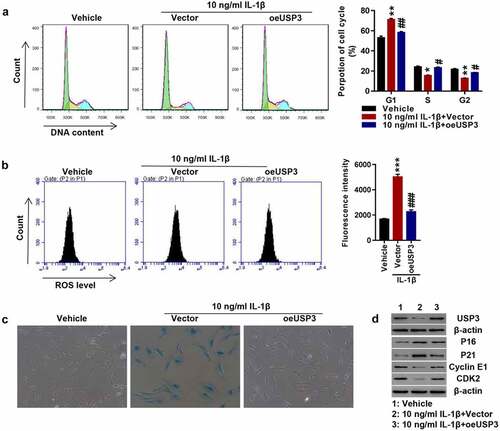
Figure 2. USP3 regulated SIRT3 expression probably by inhibiting SIRT3 ubiquitination.
The primary chondrocytes were transfected with USP3 over expression lentivirus or control vector virus (Vector) in the presence of recombinant IL-1β protein or vehicle. (A) Levels of SIRT1, SIRT2, SIRT3, and SIRT6 were detected using Western blotting. (B) mRNA levels of USP3 and SIRT3 were measured using qPCR. (C) mRNA levels of USP3 and SIRT3 were detected using qPCR after silencing of USP3. (D) Protein levels of USP3 and SIRT3 were determined by Western blotting after silencing of USP3. (E) Co-IP assay of the interaction between USP3 and SIRT3. (F) SIRT3 ubiquitination assay. (G) Correlation analysis between USP3 and SIRT3 in 16 OA cartilage samples (r = 0.8336, P < 0.001). Each data shows mean ± standard deviation from three independent biological experiments. ***p < 0.001 vs vehicle or siNC; ###p < 0.001 vs. IL-1β + vector.
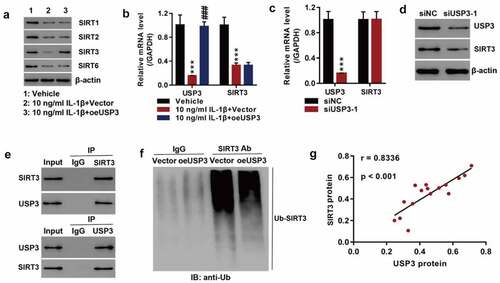
Figure 3. Inhibition of SIRT3 suppressed the effect of USP3 overexpression on IL-1β-mediated cell senescence.
Rat primary chondrocytes following USP3 overexpression were treated with IL-1β protein (10 ng/mL) along with SIRT3 inhibitor 3-TYP (50 μM). (A) Cell cycle detection by flow cytometry. (B) ROS levels by flow cytometry. (C) Cell senescence shown by SA-β-Ga1 staining. (D) Expressions of USP3, p21, p16, Cyclin E1, and CDK2 detection using Western blotting. Each data shows mean ± standard deviation from three independent biological experiments. **p < 0.01; ***p < 0.001 compared with vehicle; #p < 0.05; ##p < 0.01 compared with IL-1β + vector; ++p < 0.01; +++p < 0.001 compared with IL-1β + vector.
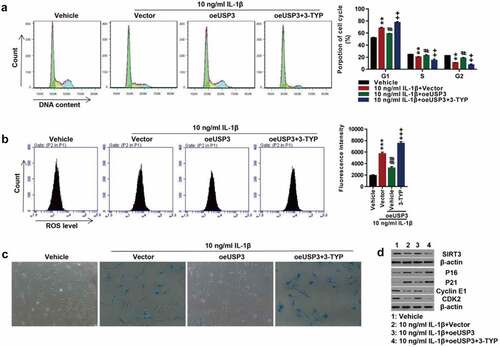
Figure 4. Overexpression of SIRT3 attenuated USP interfere-induced cell senescence.
SIRT3 was overexpressed in USP3-silencing rat primary chondrocytes. (A–B) Confirmation of SIRT3 overexpression using qPCR (A) and Western blotting (B) ***p < 0.001 vs. vector. (C) Cell cycle detection by flow cytometry. (D) ROS levels measured by flow cytometry. (E) Cell senescence shown by SA-β-Ga1 staining. (F) Expressions of SIRT3, p16, p21, Cyclin E1, CDK2, FOXO3, Ac-FOXO3, catalase, and Mn-SOD detected using Western blotting. Each data shows mean ± standard deviation from three independent biological experiments. *p < 0.05; **p < 0.01; ***p < 0.001 compared with siNC; #p < 0.05; ##p < 0.01; ###p < 0.001 compared with siUSP3-1 + vector.
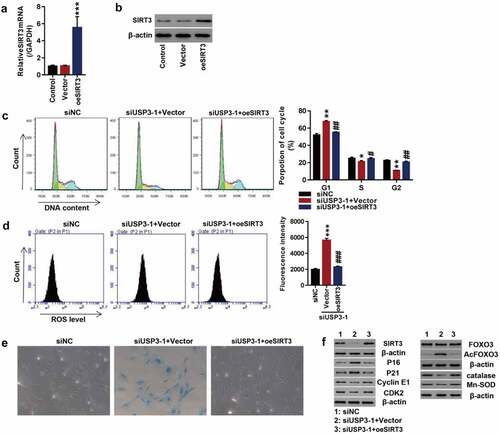
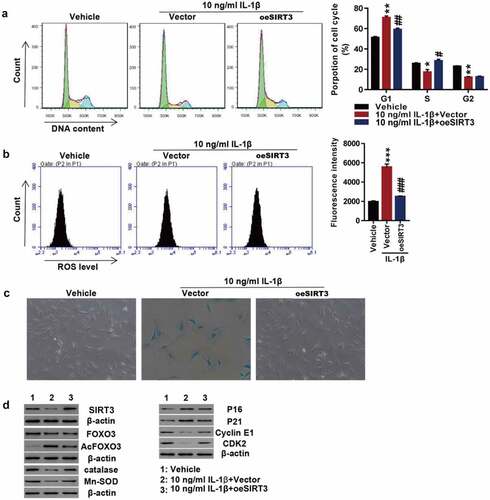
Figure 5. Overexpression of SIRT3 attenuated cell senescence probably by deacetylating FOXO3.
The primary chondrocytes were transfected with SIRT3 over expression lentivirus or control vector virus (Vector) in the presence of recombinant IL-1β protein or vehicle. (A) Cell cycle detection by flow cytometry. (B) ROS levels measured by flow cytometry. (C) Cell senescence shown by SA-β-Ga1 staining. (D) Levels of SIRT3, FOXO3, Ac-FOXO3, catalase, Mn-SOD, p16, p21, Cyclin E1, and CDK2 detected by Western blotting. Each data shows mean ± standard deviation from three independent biological experiments. *p < 0.05; **p < 0.01; ***p < 0.001 compared with vehicle; #p < 0.05; ##p < 0.01; ###p < 0.001 compared with IL-1β + vector.