Figures & data
Table 1. Primer sequences
Figure 1. Immunocytochemical staining. A: Negatively stained hBMMSCs for blank control; B: negatively stained hBMMSCs for negative control; C: negatively stained hBMMSCs for CD34; D: positively stained hBMMSCs for CD44.
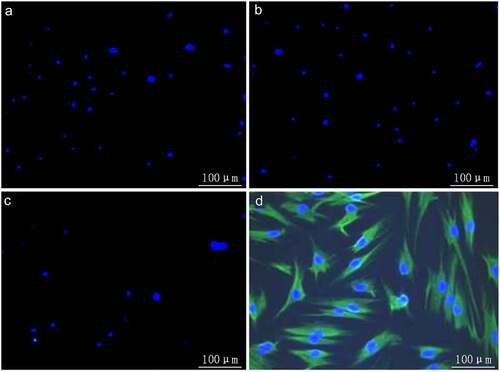
Figure 2. miRNA microarray results of hBMMSCs (A1/A2/A3) and those cultured by osteogenic induction for 21 days (B1/B2/B3).
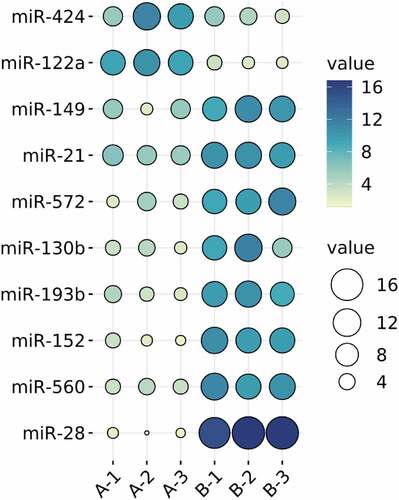
Figure 3. RT-PCR results (n = 3).
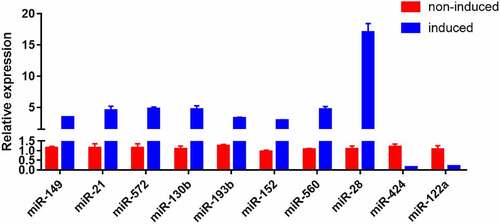
Figure 4. Expression of miR-28 significantly increased during the osteogenic differentiation of hBMMSCs. A: RUNX2 mRNA expression on days 1, 10 and 15 detected by qRT-PCR; B: AKP activity detected by AKP assay kits; C: miR-28 expression on days 1, 5, 10 and 15 detected by qRT-PCR (n = 3).
Figure 5. MiR-28 inhibited luciferase activity of STAT1 mRNA 3’UTR (n = 3).
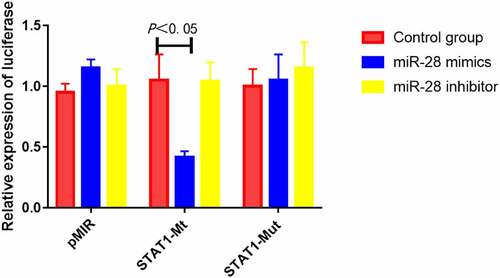
Figure 6. MiR-28 down-regulated STAT1 mRNA and protein expressions during the osteogenic differentiation of hBMMSCs. A: STAT1 mRNA expression detected by qRT-PCR; B: STAT1 protein expression detected by Western blotting (n = 3).
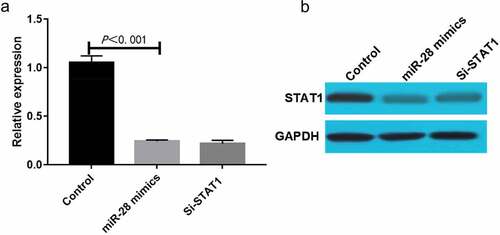
Figure 7. Interference with STAT1 or overexpression of miR-28 promoted AKP activity (n = 3).
Figure 8. Interference with STAT1 or overexpression of miR-28 promoted expression of RUNX2 (n = 3).
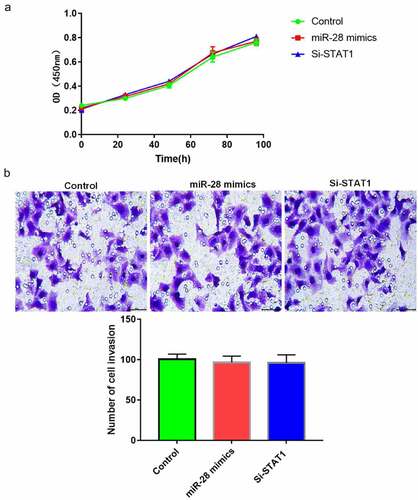
Figure 9. Interference with STAT1 or overexpression of miR-28 did not affect proliferation and migration of hBMMSCs. A: Cell proliferation detected by CCK-8 assay; B: cell migration detected by Transwell assay (n = 3).