
Figures & data
Table 1. Correlation of the lncRNA CERS6-AS1expression with clinical characteristics in GC
Figure 1. The relative expression of lncRNA CERS6-AS1 in gastric cancer tissues was increased compared with normal tissues by RT-qPCR. ***P < 0.001
Figure 2. The survival probability of 60 months of low expression of lncRNA CERS6-AS1 and high expression of lncRNA CERS6-AS1 was analyzed by the Kaplan-Meier method. The survival condition of low expression of lncRNA CERS6-AS1 was significantly higher than that of a high expression of lncRNA CERS6-AS1 (log-rank P = 0.001)
Table 2. Multivariate Cox analysis of clinical characteristics in relation to overall survival
Figure 3. Expression level of lncRNA CERS6-AS1 in different gastric cancer cell lines and analysis of transfection, proliferation, migration and invasion in gastric cancer cells HGC-27 and AGS. (a) The relative expression level of CERS6-AS1 is upregulated in different gastric cancer cells, compared with normal cells GES-1. (b) The relative expression level of CERS6-AS1 in HGC-27, and AGS cells transfected with si-CERS6-AS1 was significantly downregulated. (c) and (d) Proliferative capacity of HGC-27 and AGS cells were reduced that measured by CCK-8. (e) The Transwell assay showed that the migration ability of HGC-27, and AGS cells was down-regulated. (f) The Transwell assay showed that the invasion level of HGC-27, and AGS cells was reduced. ***P < 0.001
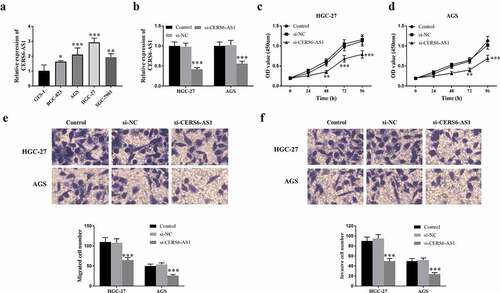
Figure 4. Luciferase reporter and the effect of CERS6-AS1 on miR-567. (a) The binding site of WT-CERS6-AS1 and miR-567. (b) Luciferase activity of WT-CERS6-AS1 and MUT-CERS6-AS1 in HGC-27 cells. (c) The miR-567 in gastric cancer tissues was down expressed compared with normal tissues by RT-qPCR. (d) The relative expression levels of CERS6-AS1 and miR-567 are negatively correlated. (e) The si-CERS6-AS1 obtained by knockdown CERS6-AS1 in HGC-27 cells increased the content of miR-567. ***P < 0.001
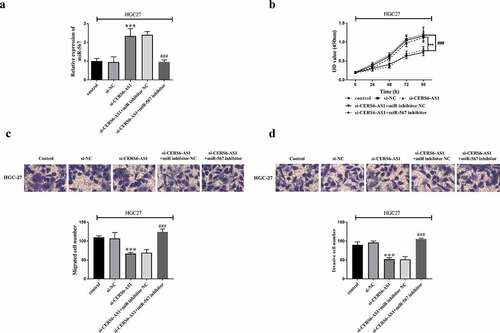
Figure 5. Co-regulated HGC-27 cells via the interaction between si-CERS6-AS1 and miR-567. HGC-27 cells were co-transfected with control, si-NC, si-CERS6-AS1, si-CERS6-AS1+ miR inhibitor NC or si-CERS6-AS1+ miR-567 inhibitor. (a) Expression of miR-567 was measured using RT-qPCR in HGC-27 cells. (b) Cell proliferation was measured by CCK-8. (c) Cell migration was analyzed using Transwell. (d) Cell invasion was analyzed using Transwell. ***P < 0.001 vs si-NC, ###P < 0.001 vs si-CERS6-AS1+ miR inhibitor NC
Data availability statement
The corresponding author can provide relevant data for this study.