Figures & data
Figure 1. Network pharmacology construction of HHT against CRC. (a) Venn diagram displays the intersection genes of CRC- and HHT-related targets. (b) ‘Compound-Target-Disease’ network consisting of 100 nodes and 196 edges. (c–e) PPI network of common targets and topological analysis
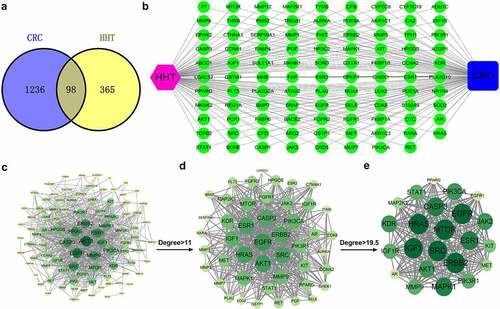
Figure 2. GO and KEGG pathway enrichment analysis of 23 core targets. (a) Enriched GO terms for biological processes (BP). (b) Enriched GO terms for cellular components (CC). (c) Enriched GO terms for molecular functions (MF). (d) Bubble chart of KEGG pathway enrichment results
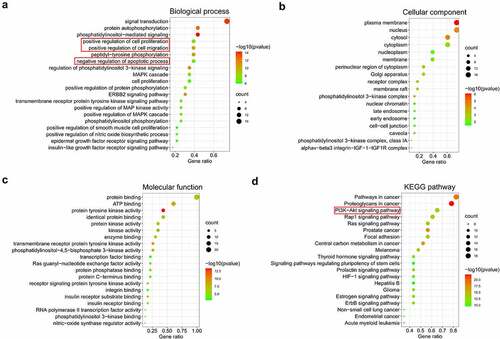
Figure 3. Effects of HHT on CRC cell proliferation and apoptosis. (a) LoVo and SW480 cells were incubated with different doses of HHT for 48 h, followed by CCK-8 assay of cell viability. (b–e) LoVo and SW480 cells were treated with HHT at 0, 0.15 and 0.3 µM for 48 h, followed by EdU assay of cell proliferation (b), flow cytometry assay of cell cycle (c), colony formation assay (d), flow cytometry assay of apoptosis (e), and Western blot assay of Bax and Bcl-2 proteins (f). **P < 0.01, ***P < 0.001 vs. 0 µM group
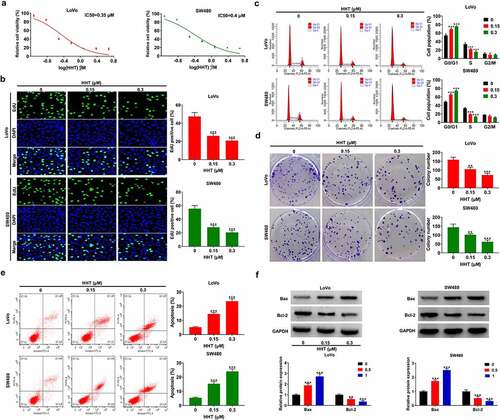
Figure 4. Effects of HHT on CRC cell migration and invasion. (a) Wound-healing assays were performed to determine the migration ability of LoVo and SW480 cells after treatment with HHT (0, 0.15 and 0.3 µM) for 24 h. (b) Transwell assays were used to measure the invasion capability after treatment with HHT (0, 0.15 and 0.3 µM) for 24 h. (c) Western blot assays were used to determine the protein levels of MMP-2 and MMP-9 in LoVo and SW480 cells after treatment with HHT (0, 0.15 and 0.3 µM) for 24 h. **P < 0.01, ***P < 0.001 vs. 0 µM group
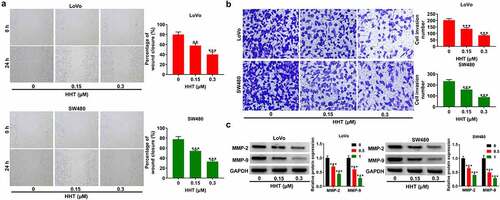
Figure 5. Effects of HHT on PI3K/AKT/mTOR signaling pathway in CRC cells. (a and b) Western blot assays were applied to detect the protein level of p-PI3K, PI3K, p-AKT, AKT, p-mTOR and mTOR in LoVo and SW480 cells after incubation with HHT (0, 0.15 and 0.3 µM) for 48 h. **P < 0.01, ***P < 0.001 vs. 0 µM group
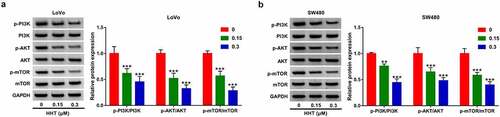
Figure 6. Activation of PI3K/AKT/mTOR signaling attenuates the inhibitory effects of HHT on cell malignant phenotypes in CRC. LoVo and SW480 cells were treated with 0.5 µM HHT alone or combined with 15 μM 740Y-P. (a) Western blot assays of p-PI3K, PI3K, p-AKT, AKT, p-mTOR and mTOR protein levels in treated cells. (b) Cell cycle progression was examined with flow cytomerty analysis. (c) Determination of colony forming potential. (d) Flow cytometry assay of apoptosis in treated cells. (e) Wound healing assays were used to evaluate cell migration. (f) Transwell assays were performed to determine cell invasion. (g) Western blot assays of Bax, Bcl-2, MMP-2 and MMP-9 proteins. *P < 0.05, **P < 0.01, ***P < 0.001 vs. Control or HHT group
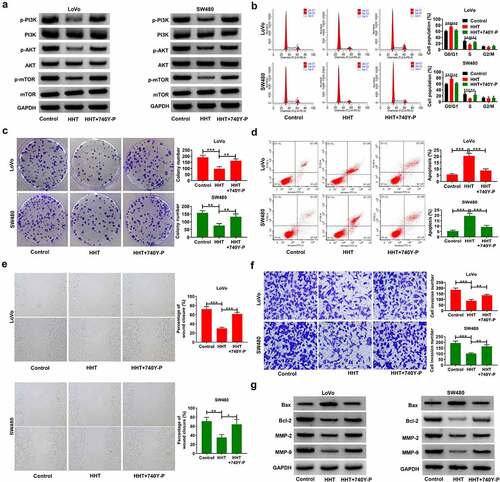
Figure 7. HHT represses CRC tumor growth in vivo. LoVo cells were subcutaneously injected into the right flank of mice. When xenograft tumors were visible, HHT (0.5 mg/kg) or PBS were administrated orally to mice. (a) Tumor size was monitored every 3 days and tumor volume was calculated. (b) Tumor weight was measured at day 23 after cell inoculation. (c) Representative images of removed tumor masses. (d) IHC analysis of Ki-67 and PCNA expression in the excised tumors. (e) Western blot assays of proteins associated with PI3K/AKT/mTOR signaling in tumors
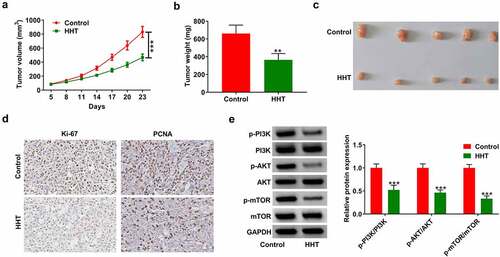
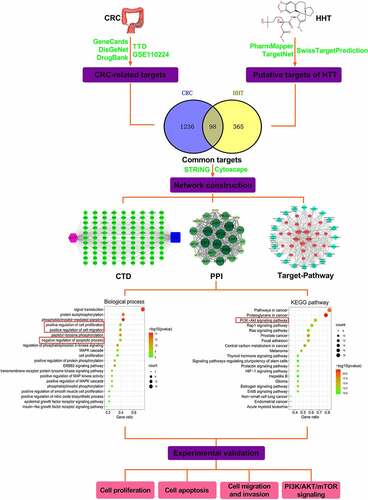
Figure 8. A flow chart of network pharmacology analysis and experiment validation to elucidate the functions and mechanisms of HHT against CRC