Figures & data
Figure 1. Octreotide elevated the viability of BEAS-2B cells stimulated by LPS. (a) The chemical formula of Octreotide. (b) Cell viability was assessed with a CCK-8 assay after BEAS-2B cells being treated with 0.1, 1, 10, 100, 1000 and 10,000 nM Octreotide. *P < 0.05, ***P < 0.001 vs. Control. Evaluation of (c) cell viability and (d) LDH in the presence or absence of Octreotide or LPS using CCK-8 and LDH assays. ***P < 0.001 vs. Control; #P < 0.05, ###P < 0.001 vs. LPS.
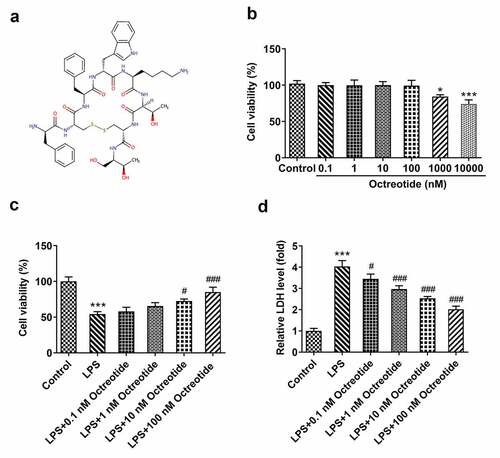
Figure 2. Octreotide relieved inflammation, apoptosis while stimulated autophagy in BEAS-2B cells under LPS condition. The corresponding ELISA kits were to appraise (a) TNF-α, (b) IL-1β and (c) IL-6 levels. (d) The apoptotic ability was estimated by TUNEL staining. (e) Quantification of apoptosis rate. (f) Determination of apoptosis-related proteins expression with Western blot analysis. (g) The expression of LC3II/I and Beclin1 was tested by Western blot. *P < 0.05, ***P < 0.001 vs. Control; ##P < 0.01, ###P < 0.001 vs. LPS.
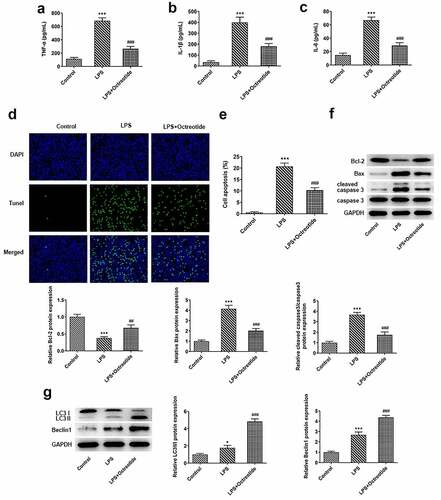
Figure 3. Autophagy inhibitor 3-MA blocked Octreotide role in inflammation and apoptosis stimulated by LPS. (a) Detection of LC3II/I and Beclin1 expression using Western blot analysis. Assessment of (b) TNF-α, (c) IL-1β and (d) IL-6 levels by ELISA kits. (e) Cell apoptosis was tested by TUNEL staining. (f) Quantification of apoptosis rate. (g) Expression of apoptosis-related proteins was examined with Western blot assay. *P < 0.05, ***P < 0.001 vs. Control; ###P < 0.001 vs. LPS; $P < 0.05, $$P < 0.01, $$$P < 0.001 vs. LPS+Octreotide.
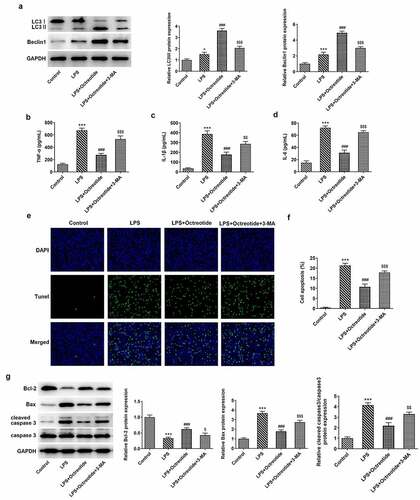
Figure 4. Octreotide induced autophagy activation in LPS-induced BEAS-2B cells by inhibiting the AKT/mTOR signalijng pathway. (a) The expression of p-AKT and mTOR in the presence or absence of Octreotide in BEAS-2B cells challenged with LPS was assessed with Western blotting. ***P < 0.001 vs. Control; #P < 0.05, ##P < 0.01 vs. LPS. (b) Western blot analyzed p-AKT and mTOR protein levels in BEAS-2B cells exposed to LPS after adding SC79 or rapamycin. (c) Test for LC3II/I and Beclin1 protein levels in n BEAS-2B cells exposed to LPS after adding SC79 or rapamycinu sing Western blot analysis. *P < 0.05, ***P < 0.001 vs. Control; ###P < 0.001 vs. LPS; $P < 0.05, $$P < 0.01, $$$P < 0.001 vs. LPS+Octreotide.
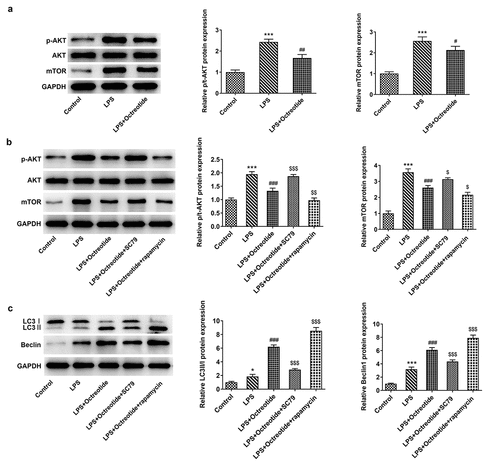
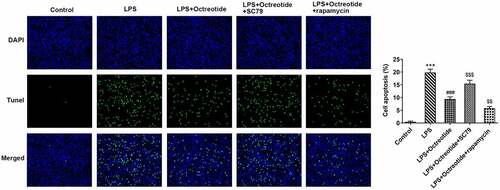
Figure 5. Octreotide inhibited the AKT/mTOR signaling pathway to ameliorate the induced cell apoptosis on account of LPS. Cell apoptosis was determined with TUNEL staining. ***P < 0.001 vs. Control; ###P < 0.001 vs. LPS; $$P < 0.01, $$$P < 0.001 vs. LPS+Octreotide.