Figures & data
Table 1. Primer sequences
Figure 1. Fibrogenic and hypoxia markers were upregulated in MIA-induced KOA rats and downregulated by IMP. (a) Chemical structure of imperatorin. (b) mRNA and protein levels of HIF-1α, TGF-β1, TIMP1 and VEGF in Normal, MIA-induced KOA and KOA rats treated with IMP determined by qRT-PCR and Western blotting. (c) Representative synovium tissues undergoing Sirius red staining or H&E staining, 200×, scale bar = 100 μm. Values are represented as mean ± SEM (*p < 0.05, **p < 0.01)
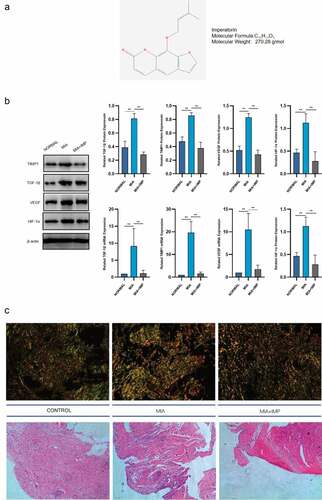
Figure 2. NLRP3 inflammasome was activated in MIA-induced KOA rats and partly inhibited by IMP. (a) Expression of NLRP3, ASC, pro-caspase-1 and P10 determined by Western blotting. The upregulation of NLRP3 inflammasome protein expression was inhibited by IMP. (b) mRNA levels were quantified by qRT-PCR in fibroblasts treated with or without LPS (5 μg/mL) or treated with LPS (5 μg/mL) and IMP. The upregulation of NLRP3 inflammasome mRNA expression was inhibited by IMP. (c) Serum concentrations of IL-1β and IL-18. Values are represented as mean ± SEM (*p < 0.05, **p < 0.01)
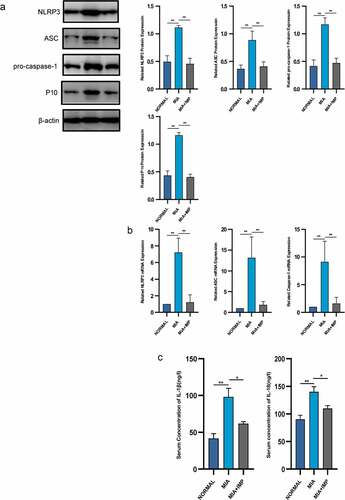
Figure 3. Fibrogenic marker expressions induced by LPS in fibroblasts were upregulated and downregulated by IMP. (a) Expression of TGF-β1, TIMP1 and VEGF determined by Western blotting. The protein expressions of these fibrogenic markers were inhibited by IMP. (b) mRNA levels were quantified by qRT-PCR in fibroblasts treated with or without LPS (5 μg/mL) or treated with LPS (5 μg/mL) and IMP (50 μM). The mRNA expressions of these fibrogenic markers were inhibited by IMP. Values are represented as mean ± SEM (*p < 0.05, **p < 0.01)
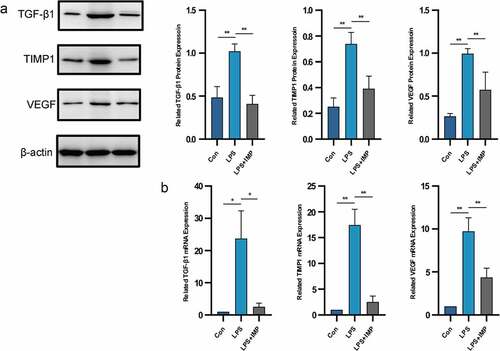
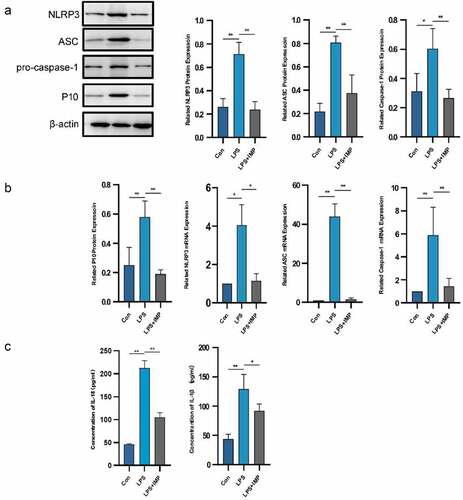
Figure 4. NLRP3 inflammasome was activated by LPS in fibroblasts and partly inhibited by IMP. (a) Expression of NLRP3, ASC, pro-caspase-1 and P10 determined by Western blotting. The protein expression levels were inhibited by IMP compared to those in the LPS group. (b) The mRNA levels were quantified by qRT-PCR in fibroblasts treated with or without LPS (5 μg/mL) or treated with LPS (5 μg/mL) and IMP (50 μM). The mRNA expression levels were inhibited by IMP compared to those in LPS group. Values are represented as mean ± SEM (*p < 0.05, **p < 0.01). (c) Inflammation cytokines IL-1β and IL-18 were measured by ELISA. Values are represented as mean ± SEM (*p < 0.05, **p < 0.01)