
Figures & data
Figure 1. The cytotoxicity of Sitagliptin in human endometrial stromal cells (HESCs). Cells were stimulated with Sitagliptin at concentrations of 10, 20, 100, 200, 1000, 2000 nM for 24 hours. Release of LDH (*, **, P < 0.05, 0.01 vs. vehicle group, n = 6).
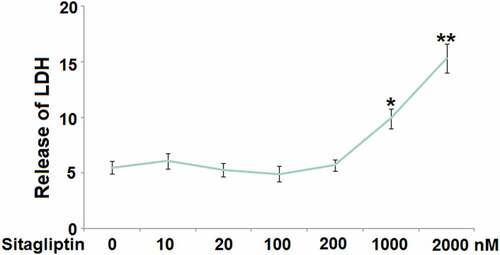
Figure 2. Sitagliptin mitigated hypoxia-induced oxidative stress in human endometrial stromal cells (HESCs). Cells were stimulated with Sitagliptin (100, 200) for 2 hours, followed by exposure to hypoxia for 6 hours. (a). The levels of ROS; (b). The levels of reduced GSH (****, P < 0.0001 vs. vehicle group; #, ##, P < 0.05, 0.01 vs. Sitagliptin group, n = 5).
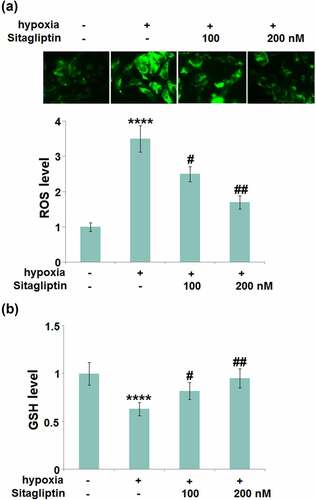
Figure 3. Sitagliptin inhibited hypoxia-induced expressions of TNF-α, IL-6, and MCP-1. Cells were stimulated with Sitagliptin (100, 200 nM) for 2 hours, followed by exposure to hypoxia for 6 hours. (a). mRNA of TNF-α, IL-6, and MCP-1; (b). Protein levels of TNF-α, IL-6, and MCP-1 as measured by ELISA (****, P < 0.0001 vs. vehicle group; #, ##, P < 0.05, 0.01 vs. Sitagliptin group, n = 6).
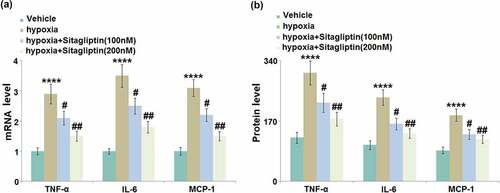
Figure 4. Sitagliptin reduced the expression of COX-2 and PGE2 against hypoxia. Cells were stimulated with Sitagliptin (100, 200 nM) for 2 hours, followed by exposure to hypoxia for 6 hours. (a). mRNA of COX-2; (b). Protein of COX-2; (c). Secretions of PGE2 (****, P < 0.0001 vs. vehicle group; #, ##, P < 0.05, 0.01 vs. Sitagliptin group, n = 6).
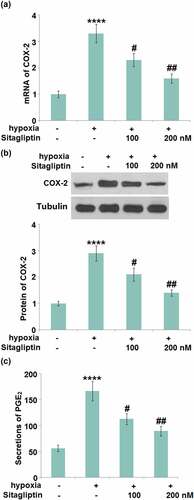
Figure 5. Sitagliptin ameliorated hypoxia-induced expression of HMGB-1 in human endometrial stromal cells (HESCs). Cells were stimulated with Sitagliptin (100, 200 nM) for 2 hours, followed by exposure to hypoxia for 6 hours. (a). mRNA of HMGB-1; (b). Secretions of HMGB-1 (****, P < 0.0001 vs. vehicle group; #, ##, P < 0.05, 0.01 vs. Sitagliptin group, n = 5).
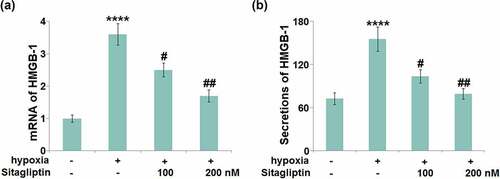
Figure 6. Sitagliptin prevented hypoxia-induced activation of p38 MAPK in human endometrial stromal cells (HESCs). Cells were stimulated with Sitagliptin (100, 200 nM) for 2 hours, followed by exposure to hypoxia for 6 hours. P-p38 and total p38 were measured by Western blot analysis (****, P < 0.0001 vs. vehicle group; #, ##, P < 0.05, 0.01 vs. Sitagliptin group, n = 5).
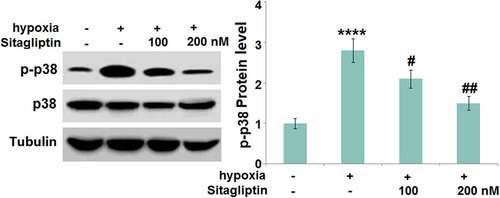
Figure 7. Sitagliptin attenuated hypoxia-induced phosphorylation and degradation of IκBα. Cells were stimulated with Sitagliptin (100, 200 nM) for 2 hours, followed by exposure to hypoxia for 6 hours. p-IκBα and total IκBα (****, P < 0.0001 vs. vehicle group; #, ##, P < 0.05, 0.01 vs. Sitagliptin group, n = 5).
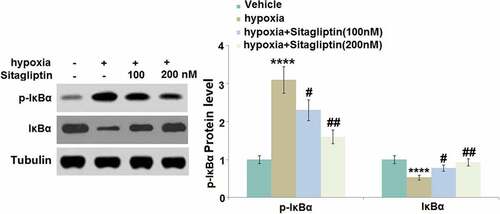
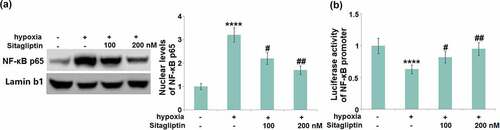
Figure 8. Sitagliptin prevented hypoxia-induced activation of NF-κB. Cells were stimulated with Sitagliptin (100, 200 nM) for 2 hours, followed by exposure to hypoxia for 6 hours. (a). Nuclear levels of NF-κB p65; (b). Luciferase activity of NF-κB promoter (****, P < 0.0001 vs. vehicle group; #, ##, P < 0.05, 0.01 vs. Sitagliptin group, n = 6).
Data availability statement
The data that support the findings of this study are available from the corresponding author upon reasonable request.