Figures & data
Figure 1. BUB1B is upregulated in LUAD, linked to the dismal outcome and a recommended biomarker for LUAD diagnosis by bioinformatic analysis. (a) The mRNA expression of BUB1B in normal tissues and LUAD tissues from the TCGA database. (b) The BUB1B expression in different TNM stages in the TCGA LUAD cohort. (c, d) The correlation between BUB1B expression and Ki67 (c) or PCNA (d) expression in the TCGA LUAD cohort. (e) The expression of BUB1B in normal tissues and LUAD tissues from the GSE7670, GSE10072, and GSE19188. (F, G, H) The overall survival and disease-free survival curves of LUAD patients with low and high BUB1B expression from the TCGA database(f), GSE31210(g), and GSE37745(h). (i) The prognostic utility of BUB1B expression from the TCGA LUAD cohort, GSE7670, GSE10072, and GSE19188. **p < 0.01.
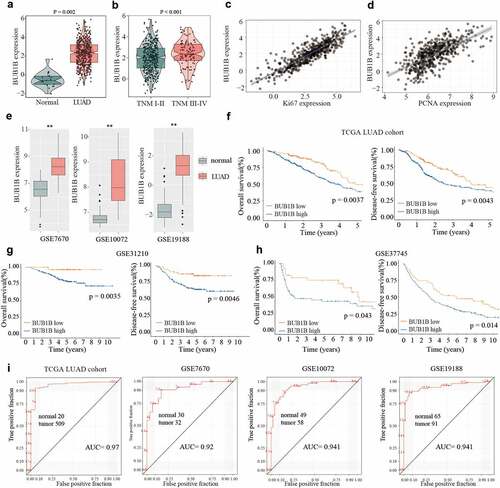
Figure 2. BUB1B is significantly increased in LUAD tissue and predicts poor outcome in LUAD patients. (a) Representative BUB1B IHC staining with different BUB1B staining scores in LUAD. (b) Representative BUB1B IHC staining in LUAD tissues and adjacent non-tumor normal tissues (left) and comparison of IHC staining score distributions between them (right). (c, d, e)Representative BUB1B IHC staining in LUAD tissues with different TNM stages(c), absence or presence of recurrence(d), and absence or presence of distant metastasis(e). (f, g) Kaplan-Meier analysis of OS(f) and DFS (g) in LUAD patients with low or high BUB1B expression.
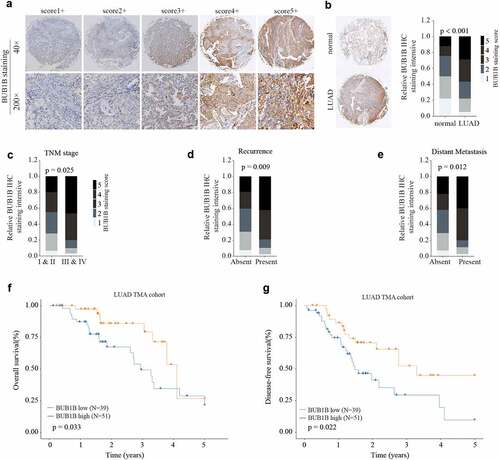
Figure 3. BUB1B deletion suppresses LUAD tumorigenicity in vitro. (a) Western blot analysis for BUB1B expression in LUAD cell lines including H460, SK-LU-1, NCI-H1299, A549, and NCI-H2087 and 16HBE. (b, c) qRT-PCR (b) and Western blot analysis (c) for BUB1B expression in the A549 or SK-LU-1 cells which were transfected with si-NC, 30 Mm siRNA targeting BUB1B(si-BUB1B), or 60 mM si-BUB1B. (d) CCK-8 proliferation assays in BUB1B-knockdown A549 (left) or SK-LU-1 (right) cells. (e) Colony formation assays in BUB1B-knockdown A549 or SK-LU-1 cells. (f) Representative immunofluorescence photos of EDU positive cells in BUB1B-knockdown A549 or SK-LU-1 cells. (g) Cell invasion analysis in BUB1B-knockdown A549 or SK-LU-1 cells. (i) Wound-healing assays in BUB1B-knockdown A549 or SK-LU-1 cells. *p < 0.05, **p < 0.01.
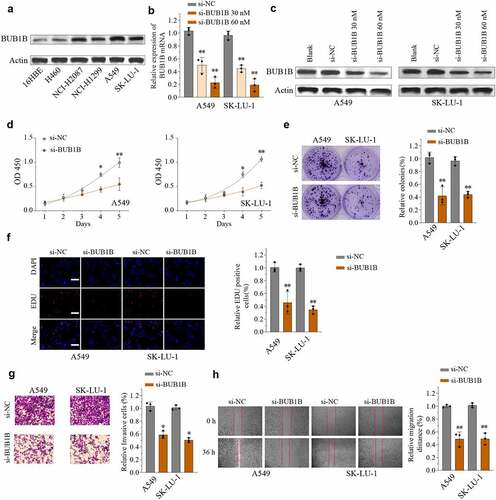
Figure 4. BUB1B knockdown inhibits lung tumor growth in vivo. (a) Representative bioluminescence imaging of nude mice and lung tumor tissues from control or sh-BUB1B group at week 1 and week 5. (b) Growth curves of tumor from control or sh-BUB1B group every week. (c) Tumor weight from control or sh-BUB1B group at week 5. (d) Ki-67 expression of tumor sections from the control or sh-BUB1B group. scale bar = 200 μm. *p < 0.05, **p < 0.01.
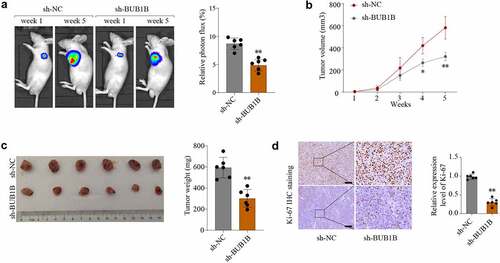
Figure 5. BUB1B regulates glycolysis in LUAD.(a-b) KEGG (a) and HALLMARK (b) analysis of the top 2000 genes with BUB1B overexpression in the LUAD TCGA cohort. (c–e) GSEA of the relationship between BUB1B expression and cell cycle (c), glycolysis (d), and fatty acid metabolism (e). (f)Western blot analysis for GLUT1, LDHA, PKM2, and HK2 expression in BUB1B-knockdown A549 or SK-LU-1 cells. (g, h)The glucose consumption (g) and the lactate production (E) in BUB1B-knockdown A549 or SK-LU-1 cells. **p < 0.01.
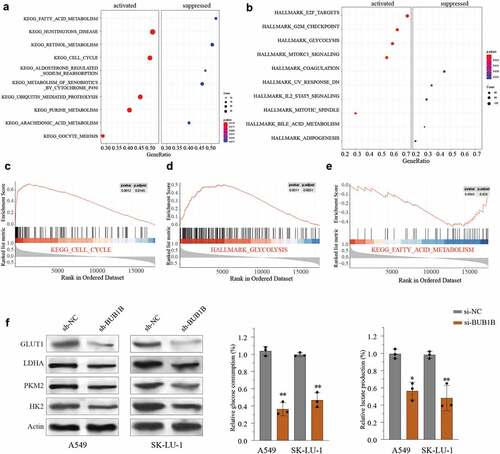
Figure 6. BUB1B interacts with ZNF143 in LUAD cells. (a, b) qRT-PCR analysis for BUB1B expression in ZNF143-knockdown (a) and ZNF143-overexpressing (b)A549 or SK-LU-1 cells. (c) CHIP assay of BUB1B with ZNF143 plasmid or siRNA in 293 T cells. (d) RNA pull-down assay in 293 T, A549 or SK-LU-1 cells. (e) Luciferase reporter assay of ZNF143 transcriptional activity in A549 or SK-LU-1 cells. (f) The correlation between BUB1B expression and ZNF143 expression in the TCGA LUAD cohort. **p < 0.01.
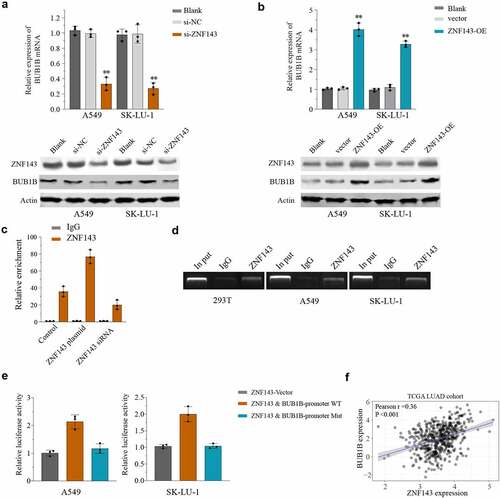
Figure 7. ZNF143 enhances the tumorigenicity of LUAD cells by controlling BUB1B. (a) Western blot analysis for BUB1B expression in ZNF143-knockdown A549 or SK-LU-1 cells co-transfected with BUB1B. (b) CCK-8 proliferation assays in ZNF143-knockdown A549(left) or SK-LU-1 (right) cells co-transfected with BUB1B. (c) Colony formation assays in ZNF143-knockdown A549 or SK-LU-1 cells co-transfected with BUB1B. (d) Cell invasion analysis in ZNF143-knockdown A549 or SK-LU-1 cells co-transfected with BUB1B. scale bar = 50 μm.*p < 0.05, **p < 0.01.
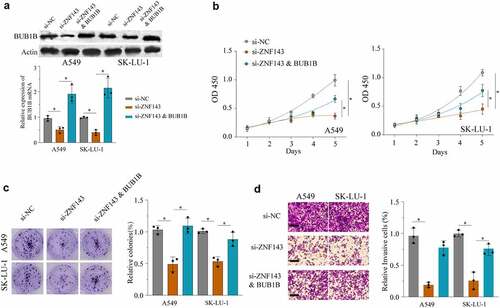
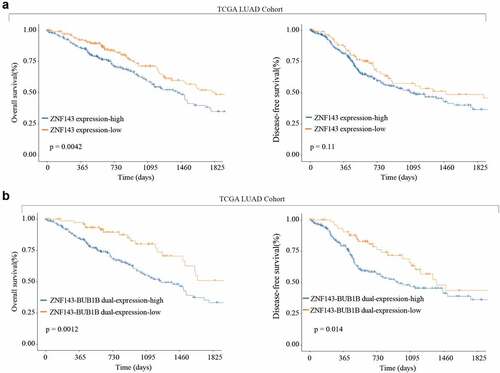
Figure 8. High ZNF143 expression indicates poor prognosis like BUB1B in LUAD. (a) Kaplan-Meier analysis of OS (left) and DFS (right) in LUAD patients with low or high ZNF143 expression. (c, d) Kaplan-Meier analysis of OS (c) and DFS (d) in LUAD patients with dual low or high ZNF143 and BUB1B expression.