Figures & data
Table 1. The primers are as follows
Figure 1. The higher expression of lncRNA HCP5 is in esophageal cancer tissues. (a), The expression levels of HCP5 in esophageal cancer tissues and normal tissues were analyzed by TCGA database; (b), HCP5 expression in total pairs of esophageal cancer tissues and adjacent tissues was examined by RT-qPCR; (c), The levels of HCP5 were examined by RT-qPCR in Het-1A and esophageal cancer cells; (d), The expressions of HCP5 in KYSE30 and TE-1 cells were detected after a single 2 Gy dose of radiation; (e), The expressions of HCP5 in KYSE30 and TE-1 cells were detected after different dose of radiation. Data are presented as mean ± SD, n = 3. *P < 0.05, **P < 0.01, ***P < 0.001.
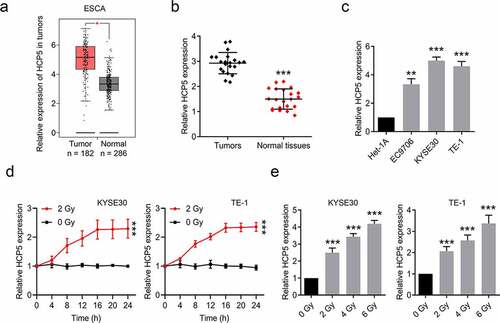
Figure 2. Knockdown of HCP5 further inhibits esophageal cancer cells proliferation and promotes apoptosis combined with a single dose of radiation. (a), The expression levels of HCP5 were detected after cells infected with lentiviral shHCP5; (b), The cell viability was detected by CCK-8 assay in KYSE30 and TE-1 cells; (c), The colony formation was examined in KYSE30 and TE-1 cells; (d), The apoptosis was examined in KYSE30 and TE-1 cells. Data are presented as mean ± SD, n = 5. * compared to the group of shNC + 0 Gy; *P < 0.05, **P < 0.01, ***P < 0.001; # compared to other group of shHCP5 + 2 Gy; #P < 0.05, ##P < 0.01.
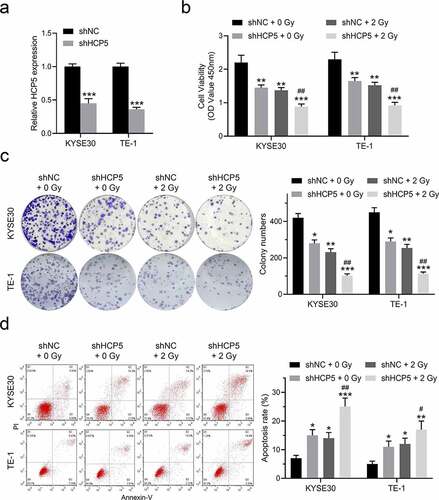
Table 2. The relative radiosensitization effects in KYSE30 and TE-1
Figure 3. Knockdown HCP5 enhances the efficacy of radiotherapy for esophageal carcinoma. (a) and (c), The colony formation was examined in KYSE30 and TE-1 cells with different dose of radiation; (b) and (d), The cellular survival curves of KYSE30 and TE-1 cells.
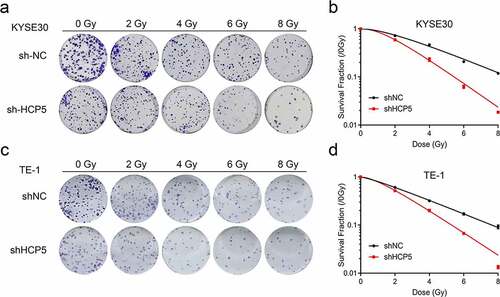
Figure 4. HCP5 functions by regulating miR-216a-3p/PDK1 axis. (a), The binding site between HCP5 and miR-216a-3p; (b), The expression of miR-216a-3p in shHCP5 KYSE30 and TE-1 cells; (c), The expression of miR-216a-3p in KYSE30 and TE-1 cells with miR-216a-3p mimic; (d), The luciferase intensity in KYSE30 and TE-1 cells; (e), The binding site between 3ʹUTR of PDK1 and miR-216a-3p; (f), The luciferase intensity in KYSE30 and TE-1 cells; (g), The mRNA expression of PDK1 in shHCP5 KYSE30 and TE-1 cells; (h), The protein expression of PDK1 in KYSE30 and TE-1 cells. Data are presented as mean ± SD, n = 5. *P < 0.05, **P < 0.01, ***P < 0.001.
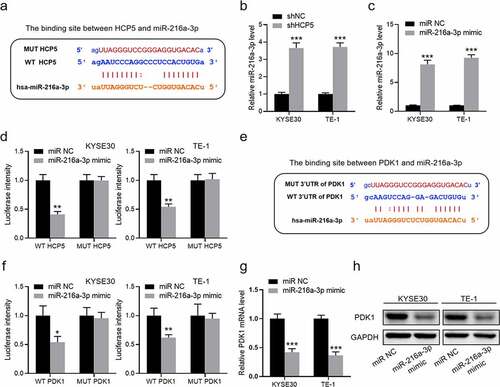
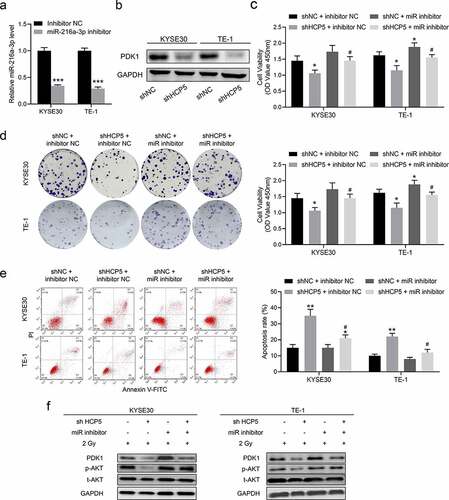
Figure 5. Knockdown HCP5 modulates the miR-216a-3p/PDK1 axis to inhibit AKT activation. (a), The expression of miR-216a-3p in KYSE30 and TE-1 cells with miR-216a-3p inhibitor; (b), The protein expression of PDK1 in shHCP5 KYSE30 and TE-1 cells; (c), The cell viability was detected by CCK-8 assay in KYSE30 and TE-1 cells; (d); The colony formation was examined in KYSE30 and TE-1 cells; (e), The apoptosis was examined in KYSE30 and TE-1 cells; (f), The activation AKT signaling in KYSE30 and TE-1 cells was examined by Western blot. Data are presented as mean ± SD, n = 5. * compared to the group of shNC + inhibitor NC; *P < 0.05, **P < 0.01; # compared to other group of shHCP5 + inhibitor NC; #P < 0.05.