Figures & data
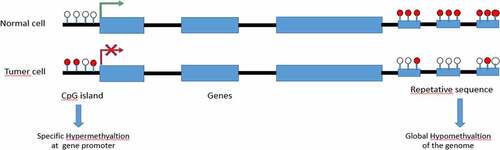
Graph.1; The diagram shows a representative region of genomic DNA in a normal cell. The region shown contains repeat-rich, hypermethylated pericentromeric heterochromatin and an actively transcribed tumor suppressor gene (TSG) associated with a hypomethylated CpG Island (indicated in red). In tumor cells, repeat-rich heterochromatin becomes hypomethylated and this contributes to genomic instability, a hallmark of tumor cells, through increased mitotic recombination events. De novo methylation of CpG Islands also occurs in cancer cells and can result in the transcriptional silencing of growth-regulatory genes. These changes in methylation are early events in tumorigenesis.
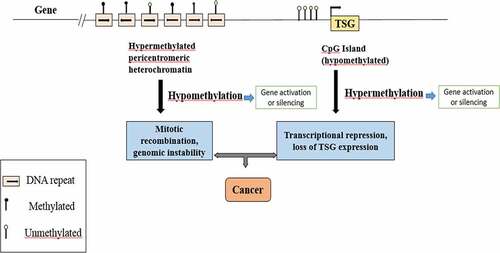
Table 1. Summary of arabidopsis genome DNA methyltransferase [Citation187]
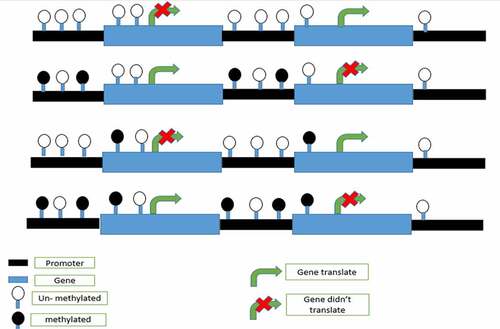
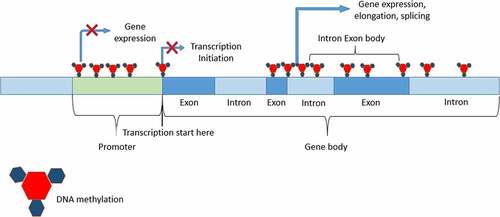
Graph.2; In the graph, it is shown that DNA methylation on any part of gene may stop translation or may not depend on the DNA methylation role.
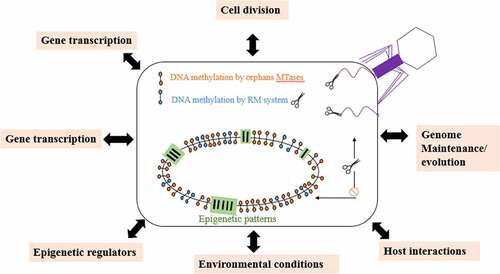
Graph.3; Dfferent function performed by DNA methylation in bacteria and archaea.
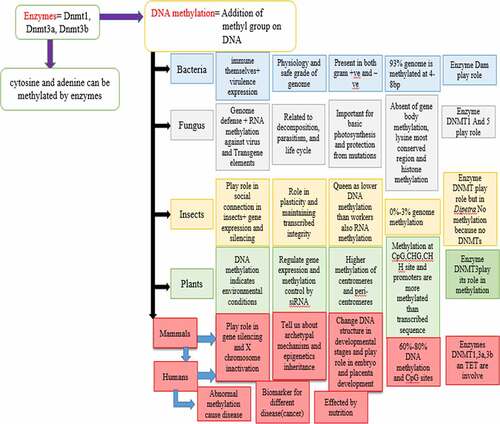
Graph.4; The diagram explains how the DNA methylation is distributed and the presence of DNA methylatransferase across the eukaryotes. The black and white circles indicate the presence and absence of DNA methyltransferase/methylation, respectively [Citation186].
![Graph.4; The diagram explains how the DNA methylation is distributed and the presence of DNA methylatransferase across the eukaryotes. The black and white circles indicate the presence and absence of DNA methyltransferase/methylation, respectively [Citation186].](/cms/asset/deecf8c7-1174-4765-b01c-963ac4f8f548/kbie_a_2014387_uf0005_oc.jpg)
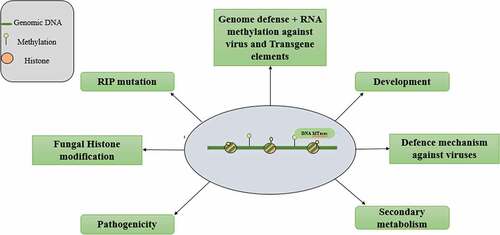
Graph.5; Different functions performed by DNA methylation in fungi.
Graph.6; The effect of DNA methylation on different sites of DNA.
Graph.7; The graph shows the effect of methylation on tumor.