Figures & data
Table 1. The primer sequences used in RT-qPCR
Figure 1. TINCR is upregulated in DDP-resistant CM. (a) TINCR expression in DDP-resistant or DDP-sensitive CM tissues was evaluated by RT-qPCR. (b) CCK-8 assay assessed DDP-resistant or DDP-sensitive CM viability and IC50. (c) INCR expression in DDP-resistant or DDP-sensitive CM cells was measured by RT-qPCR. *P < 0.05; **P < 0.01, n = 3.
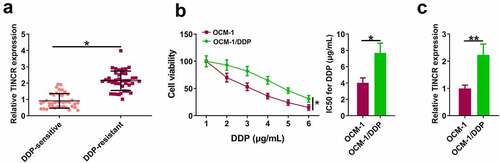
Figure 2. TINCR increases DDP resistance of CM cells. (a) RT-qPCR was used to determine TINCR expression in OCM-1/DDP cells after transfection. (b) IC50 values were measured by CCK-8 assay in OCM-1/DDP cells after transfection. (c, d) To detect OCM-1/DDP cell viability and apoptosis after transfection by CCK-8 and flow cytometry assays. (e) Bcl-2, Bax, and cleaved-caspase-3 expression were detected by Western blot analysis. *P < 0.05; **P < 0.01, n = 3.
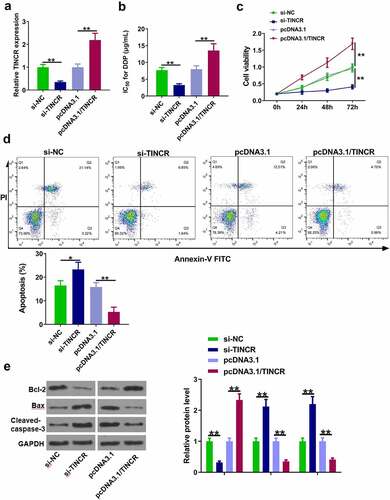
Figure 3. TINCR interacts with miR-19b-3p. (a) The interaction of TINCR and miR-19b-3p was detected by bioinformatics analysis. (b) Luciferase activity of TINCR-WT was detected by luciferase reporter assay. (c) RIP assay was used to detect the correlation between TINCR and miR-19b-3p. (d) MiR-19b-3p expression in DDP-resistant or DDP-sensitive CM tissues was measured by RT-qPCR. (e) MiR-19b-3p expression in DDP-resistant or DDP-sensitive CM cells was measured by RT-qPCR. (f) MiR-19b-3p expression in OCM-1/DDP cells after transfection was detected. (g) Correlation between TINCR and miR-19b-3p expression. **P < 0.01, *P < 0.05; n = 3.
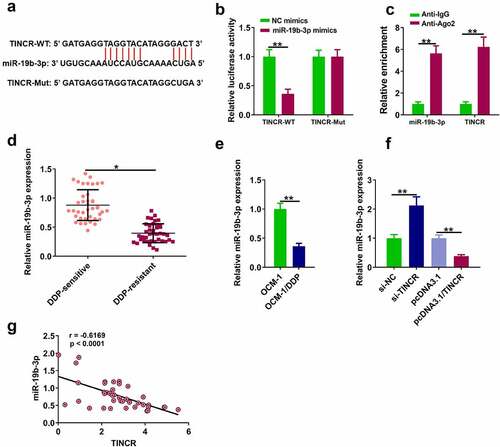
Figure 4. ERK-2 is a target of miR-19b-3p (a) The binding of miR-19b-3p to ERK-2 predicted by TargetScan software. (b) Luciferase reporter assay. (c) RIP assay was used to detect the correlations between ERK-2 and miR-19b-3p. (d) ERK-2 expression in DDP-resistant or DDP-sensitive CM tissues. (e) ERK-2 expression in DDP-resistant or DDP-sensitive CM cells. (f) ERK-2 expression in OCM-1/DDP cells was detected by RT-qPCR. (g) ERK-2 and miR-19b-3p expression levels were analyzed by Pearson analysis. **P < 0.01, *P < 0.05; n = 3.
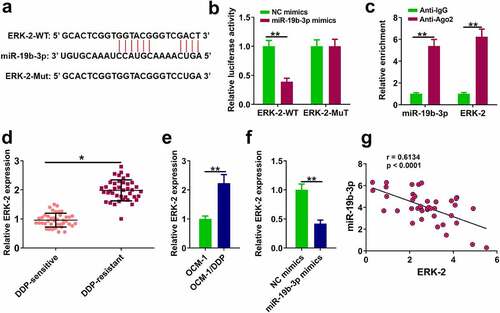
Figure 5. MiR-19b-3p reduces DDP resistance of CM cells. (a, b) ERK-2 expression was measured by Western blot and RT-qPCR. (c) IC50 values in OCM-1/DDP cells after transfection was measured. (d, e) OCM-1/DDP cell viability and apoptosis. (e, f) Bcl-2, Bax, and cleaved-caspase-3 expression. **P < 0.01, *P < 0.05; n = 3.
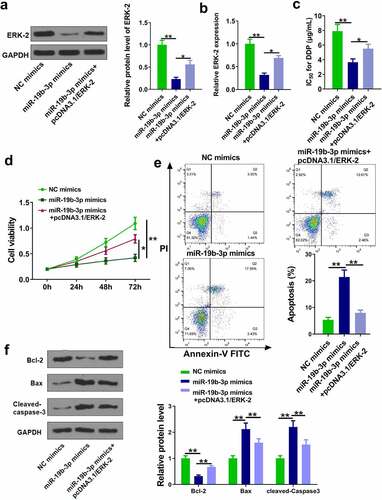
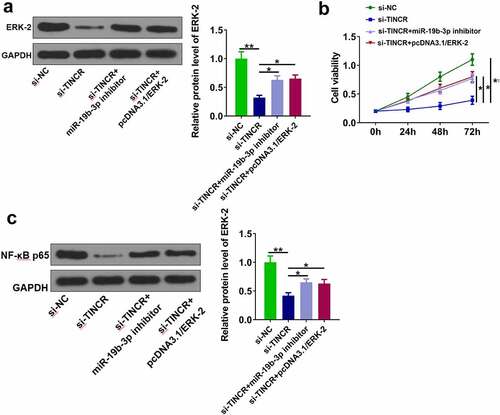
Figure 6. TINCR/miR-19b-3p/ERK-2 axis in CM cells. (a) Western blot analysis was used to measure ERK-2 protein expression. (b) IC50 values and cell viability. (c) NF-κB p65 protein expression. **P < 0.01, *P < 0.05; n = 3.