
Figures & data
Table 1. Clinical information about 80 PCa patients
Figure 1. Expression of Ezrin in prostate cancer tissues and cell lines. (a) The Ezrin expression in different stages of PCa was determined by qRT-PCR. *P < 0.05. (b) IHC staining of Ezrin was performed on PCa tissues at different stages. (c) The relative expression of Ezrin in different PCa cell lines. *P < 0.05. (d) 22RV1 cells were transfected with different plasmids to evaluate the Ezrin expression with qRT-PCR. (e) Different plasmids were transfected to PC-3 cells to assess the Ezrin expression using qRT-PCR.
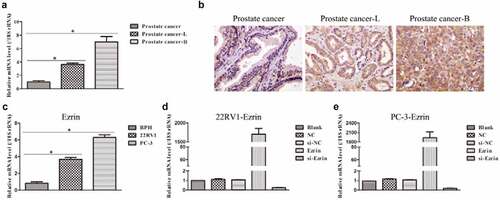
Figure 2. Transwell assays indicated marked cell migration in Ezrin-overexpression plasmid transfected 22RV1 and PC-3 cells, compared with the negative control (NC) cells. *P < 0.05.
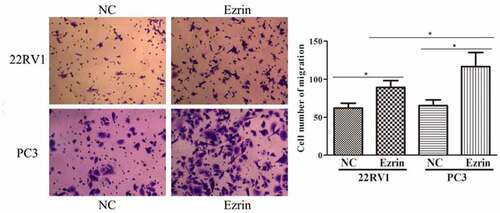
Figure 3. Transwell assays revealed marked cell invasion in Ezrin-overexpression plasmid transfected 22RV1 and PC-3 cells, compared with the negative control (NC)-tranfected cells. *P < 0.05.
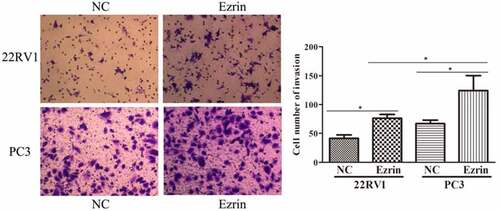
Figure 4. Ezrin expression (blue dots) in CTCs from different stage of PCa by using in situ hybridization.
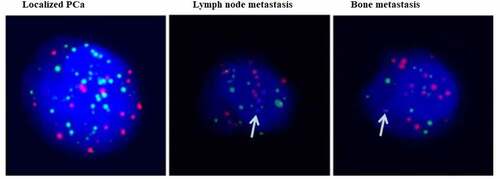
Table 2. CTC subtypes’ analysis on the 80 PCa patients
Table 3. Characteristics of 53 cases of radical prostatectomy and analysis on the expression of Ezrin in CTCs of these cases