
Figures & data
Table 1. Primer sequences used for qRT-PCR
Figure 1. Expression of NORAD and HIF-1α in CRC tissues and hypoxia-treated CRC cells. (a, b) The expression of NORAD (a) and HIF-1α (b) were analyzed by qRT-PCR. (c) Correlation between NORAD and HIF-1α in CRC tissues. (d) CRC cells (HCT116 and SW480) were exposed to hypoxia or normoxia. Then, tube formation was assessed by Three-dimensional culture. (e, f) CCK-8 assay was performed to detect cell viability in response to 5-FU treatment under hypoxic conditions. (g) The expression of NORAD in hypoxia-stimulated CRC cells was detected by qRT-PCR. *P < 0.05.
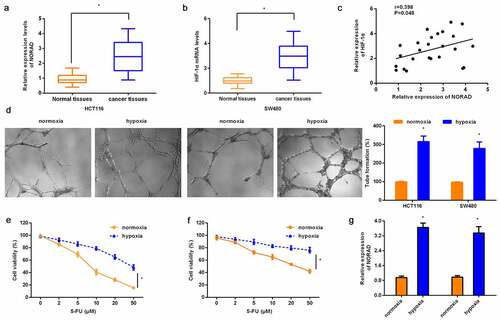
Figure 2. Loss of NORAD attenuates hypoxia-evoked VM formation. (a, b) Expression of NORAD was determined in HCT116 (a) and SW480 (b) cells that were transfected with si-NORAD or si-NC. (c, d) CRC cells were treated with si-NORAD or si-NC, prior to hypoxia exposure. Then, the expression of NORAD was analyzed. (e, f) The effects of si-NORAD transfection on hypoxia-induced VM formation were tested. (g) The transcript of VE-cadherin in CRC cells was detected. *P < 0.05 vs. control group, @P < 0.05 vs. hypoxia-treated group.
Figure 3. NORAD knockdown sensitizes CRC cells to 5-FU. CRC cells (HCT116 and SW480) under hypoxia exposure were treated with si-NORAD and 5-FU. Then, cell viability in HCT116 (a) and SW480 (b) was determined by CCK-8 assay. (c, d) Flow cytometry was used to evaluate the subsequent effects on cell apoptosis. *P < 0.05 vs. control group, @P < 0.05 vs. hypoxia-treated group.
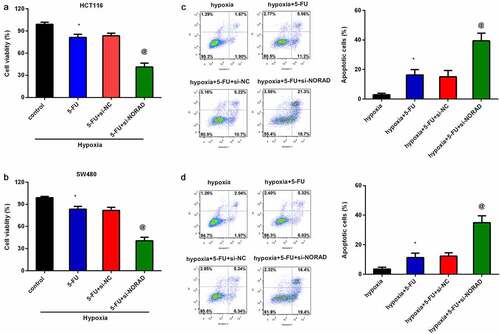
Figure 4. NORAD affects hypoxia-induced HIF-1α signaling to regulate VM formation and 5-FU resistance in CRC cells. (a, b) After transfection with si-NORAD, the mRNA (a) and protein levels (b) of HIF-1α under hypoxia-treated HCT116 cells were determined. Then, the transcript (c) and protein (d) expression of E-cadherin and N-cadherin were further analyzed. (e-h) Following treatment with si-NORAD and HIF-1α recombinant vector, cells were exposed to hypoxia conditions. After that, VM formation (e), VE-cadherin transcript (f), 5-FU-induced cell viability (g) and apoptosis (h) were analyzed. *P < 0.05 vs. control group, @P < 0.05 vs. hypoxia-treated group.
Figure 5. NORAD serves as a miR-495-3p sponge to regulate HIF-1α. (a) The putative binding site between NORAD and miR-495-3p was predicted by Starbase. (b) qRT-PCR was conducted to determine the expression of miR-495-3p in CRC tissues. (c) Correlation between miR-495-3p and NORAD was assessed by Pearson’s correlation analysis. (d) Luciferase reporter assay was carried out to elucidate the direct target relationship between miR-495-3p and NORAD. (e) The interaction between miR-495-3p and NORAD was analyzed by RIP analysis. (f) The predicted 3ʹ-UTR site of HIF-1α binding to miR-495-3p by Targetscan software. (g) The effects of miR-495-3p mimics on HIF-1α transcript were detected by qRT-PCR. (h) The directly targeted correlation between HIF-1α and miR-495-3p was validated by luciferase reporter assay. *P < 0.05.
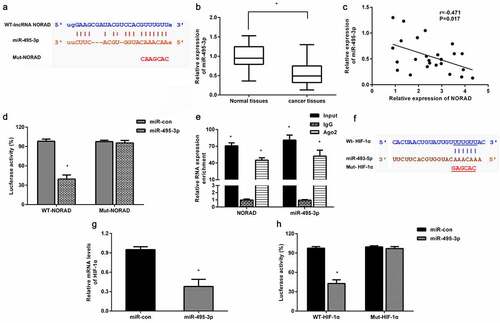
Figure 6. NORAD regulates hypoxia-induced VM and chemoresistance by sponging miR-495-3p/ HIF-1α signaling. HCT116 cells under hypoxia were treated with si-NORAR, anti-miR-495-3p. Then, the protein levels of HIF-1α, E-cadherin, N-cadherin were determined by Western blotting (a, b). Then, VM formation (c) and VE-cadherin transcript (d) were further explored. (e, f) Cell resistance to 5-FU was evaluated by determining cell viability (e) and apoptosis (f). *P < 0.05 vs. hypoxia-treated group. @P < 0.05 vs. hypoxia and si-NORAD-treated group.
Data availability statement
All data generated or analyzed during this study are included in this published article.