Figures & data
Figure 1. Identification of BMSCs and BMSCs-Exo. A. Morphology of BMSCs of P3; B. Analysis of surface markers by flow cytometry; C. TEM observed size and morphology of BMSCs-Exo; D. NTA of BMSCs-Exo; E. Western blot analysis of CD81 and CD9.
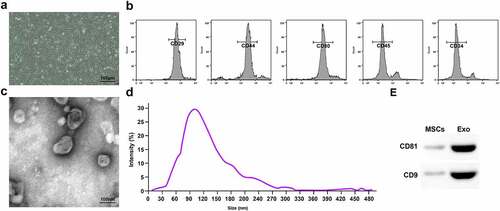
Figure 2. Successful HIBD modeling in rats. A. RT-qPCR detection of miR-124-3p and TRAF6 mRNA expression; B. Western blot detection of TRAF6 protein expression; C. Neurological function score of rats after HIBD; D. Behavioral function of rats after HIBD; E. HE staining; F. SOD and MDA levels of rats after HIBD; G. NO levels of rats after HIBD; H. TUNEL staining; I. Nissl staining; J. Bax and Bcl-2 protein expression of rats after HIBD; measurement data were expressed as mean ± standard deviation; * P < 0.05 vs. the Sham group.
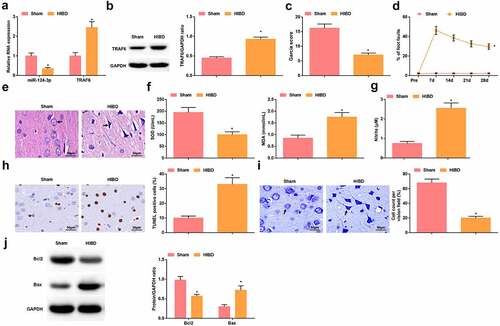
Figure 3. BMSCs-Exo improve HIBD in newborn rats. A. DiI-labeled Exo in the hippocampus of HIBD rats; B. Neurological function score of HIBD rats after injection with BMSCs-Exo; C. Behavioral function of HIBD rats after injection with BMSCs-Exo; D. HE staining; E. SOD and MDA levels of HIBD rats after injection with BMSCs-Exo; F. NO levels of HIBD rats after injection with BMSCs-Exo; G. TUNEL staining; H. Nissl staining; I. Bax and Bcl-2 protein expression in HIBD rats after injection with BMSCs-Exo; measurement data were expressed as mean ± standard deviation; * P < 0.05 vs. the HIBD group.
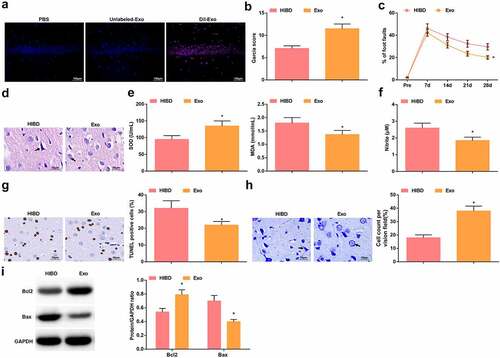
Figure 4. Up-regulated miR-124-3p further enhances the protective role of BMSCs-Exo on HIBD rats. A. miR-124-3p expression in HIBD rats after injection with Exo-miR-124-3p agomir; B. Neurological function score of HIBD rats after injection with Exo-miR-124-3p agomir; C. Behavioral function of HIBD rats after injection with Exo-miR-124-3p agomir; D. HE staining; E. SOD and MDA levels of HIBD rats after injection with Exo-miR-124-3p agomir; F. NO levels of HIBD rats after injection with Exo-miR-124-3p agomir; G. TUNEL staining; H. Nissl staining; I. Bax and Bcl-2 protein expression in HIBD rats after injection with Exo-miR-124-3p agomir; measurement data were expressed as mean ± standard deviation; * P < 0.05 vs. the Exo-agomir NC group.
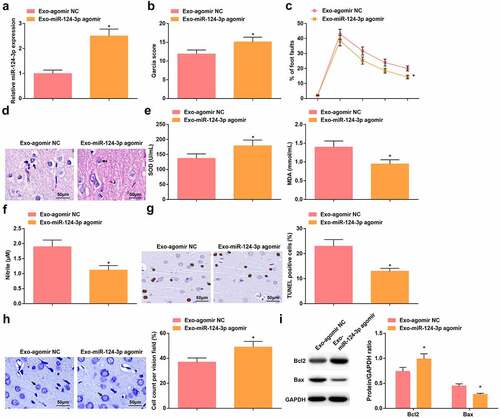
Figure 5. miR-124-3p targets TRAF6. A. Jefferson website predicted the binding site between TRAF6 and miR-124-3p; B. Dual luciferase reporter gene assay verified the targeting relationship between TRAF6 and miR-124-3p; C-D. RT-qPCR and Western blot analysis of TRAF6 expression in Exo; measurement data were expressed as mean ± standard deviation; * P < 0.05 vs. the agomir NC group.
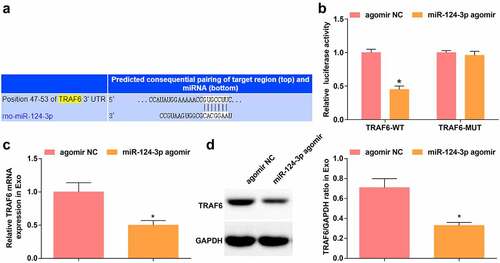
Figure 6. Depressing TRAF6 exerts protectively for rats with HIBD. A-B. RT-qPCR and Western blot analysis of TRAF6 expression in HIBD rats after injection with si-TRAF6; C. Neurological function score of HIBD rats after injection with si-TRAF6; D. Behavioral function of HIBD rats after injection with si-TRAF6; E. HE staining; F. SOD and MDA levels of HIBD rats after injection with si-TRAF6; G. NO levels of HIBD rats after injection with si-TRAF6; H. TUNEL staining; I. Nissl staining; J. Bax and Bcl-2 protein expression in HIBD rats after injection with si-TRAF6; measurement data were expressed as mean ± standard deviation; * P < 0.05 vs. the si-NC group.
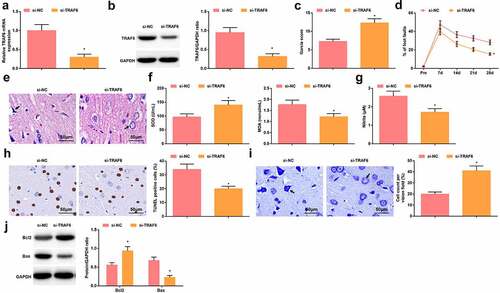
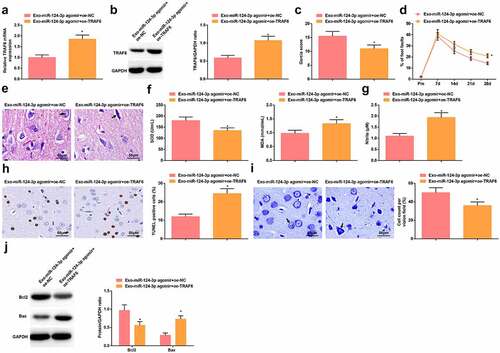
Figure 7. Elevating TRAF6 antagonizes miR-124-3p-mediated protection against HIBD in rats. A-B. RT-qPCR and Western blot analysis of TRAF6 expression in HIBD rats in rescue experiment; C. Neurological function score of HIBD rats in rescue experiment; D. Behavioral function of HIBD rats in rescue experiment; E. HE staining; F. SOD and MDA levels of HIBD rats in rescue experiment; G. NO levels of HIBD rats in rescue experiment; H. TUNEL staining; I. Nissl staining; J. Bax and Bcl-2 protein expression in HIBD rats in rescue experiment; measurement data were expressed as mean ± standard deviation; * P < 0.05 vs. the Exo-miR-124-3p agomir + oe-NC group.