Figures & data
Table 1. Sequences of primers used in qRT-PCR
Figure 1. DSCAM-AS1 was upregulated in pancreatic cancer. (a) IHC assay of DSCAM-AS1 in tumor tissues. ×400, scale bar = 50 μm. (b and c) DSCAM-AS1 level in tumor tissues (n = 30) (b) and cancer cell lines (c).
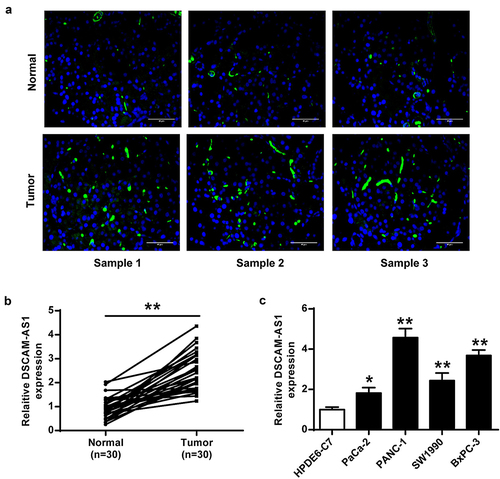
Figure 2. DSCAM-AS1 inhibition efficiently prevented pancreatic cancer progression in vitro. PANC-1 cells were transfected with two siRNAs targeting DSCAM-AS1. (a) DSCAM-AS1 level. (b) CCK-8 assay. (c) Colony formation assay. (d) Migration assay. (e) Invasion assay. ×200, scale bar = 100 μm. ** p < 0.01 vs. si-NC.
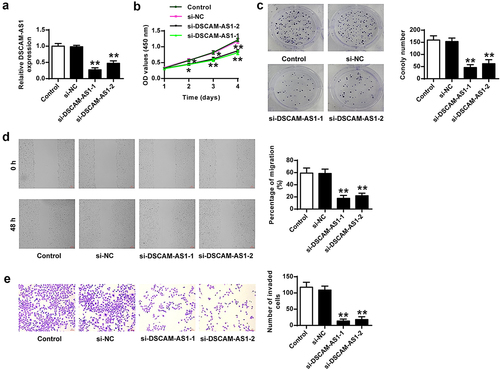
Figure 3. DSCAM-AS1 knockdown inhibited tumor growth in vivo. (a) DSCAM-AS1 level in tumor tissues by qRT-PCR. (b) Representative tumor images. (c) Tumor volume. (d) Tumor weight. (e) MiR-136-5p and PBX3 levels in tumor tissues by qRT-PCR. (f) PBX3 level in tumor tissues. (g) Ki-67 levels in tumor tissues by IHC staining assay. ×200, scale bar = 100 μm.
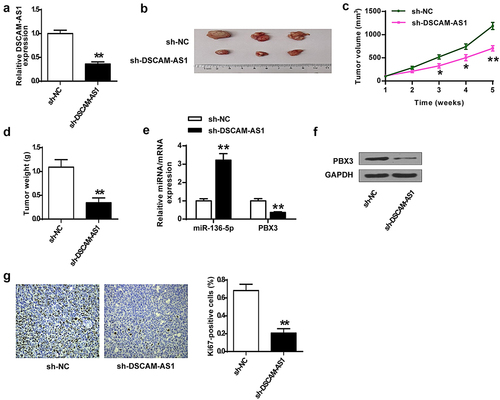
Figure 4. DSCAM-AS1 directly bound to miR-136-5p. (a) The transfection efficiency of miR-136-5p mimics or inhibitor was confirmed. (b) The putative interaction between DSCAM-AS1 and miR-136-5p by Starbase. (c) Luciferase reporter assay. (d) PNAC-1 cells were transfected with si-DSCAM-AS1-1 and si-DSCAM-AS1-1, and miR-136-5p expression was evaluated. (e) DSCAM-AS1 level in PNAC-1 cells after transfection with miR-136-5p mimics or inhibitor. (f) MiR-136-5p level in tumor tissues. (g) The correlation between DSCAM-AS1 and miR-136-5p levels in tumor tissues.
Figure 5. MiR-136-5p mimics inhibited pancreatic cancer progression, possibly via PBX3 in vitro. (a) CCK-8 assay. (b) Colony formation assay. (c) Migration assay. (d) Invasion assay. (e) The putative interaction between miR-136-5p and PBX3 by Starbase. (f) Luciferase reporter assay. (g) The transfection efficiency of DSCAM-AS1 overexpressing vector. (h and i) PBX3 level by qRT-PCR (h) and Western blot (i). (j) PBX3 level in PANC-1 cells by immunofluorescence. ×200, scale bar = 100 μm.
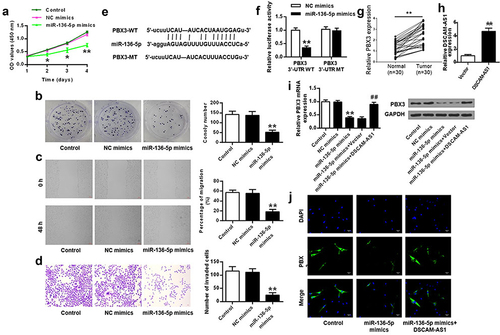
Figure 6. MiR-136-5p mediated the impact of DSCAM-AS1 in pancreatic cancer cells in vitro. (a) DSCAM-AS1 level by qRT-PCR. (b) CCK-8 assay. (c) Colony formation assay. (d) Migration assay. (e) Invasion assay. ×200, scale bar = 100 μm.
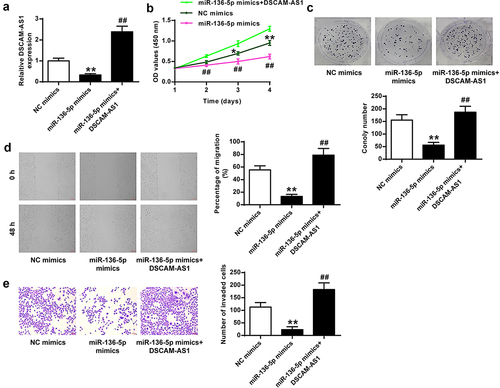
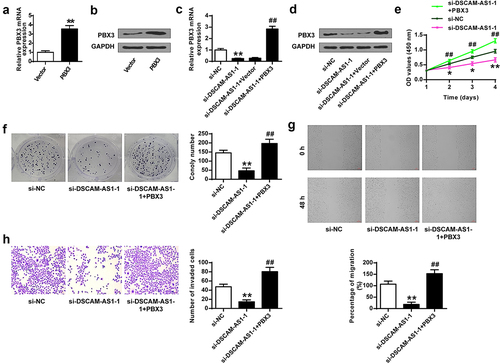
Figure 7. DSCAM-AS1 regulated pancreatic cancer progression via modulating PBX3. (a and b) The transfection efficiency by qRT-PCR (a) and Western blot (b). (c and d) PBX3 level by qRT-PCR (c) and Western blot (d). (e) CCK-8 assay. (f) Colony formation assay. (g) Migration assay. (h) Invasion assay. ×200, scale bar = 100 μm.