Figures & data
Table 1. Top 15 terms of Gene Ontology analysis of the 915 differentially expressed genes
Table 2. Top 15 terms of Kyoto Encyclopedia of Genes and Genomes pathway analysis of the 915 differentially expressed genes
Figure 1. The protein–protein interaction network of differentially expressed genes.
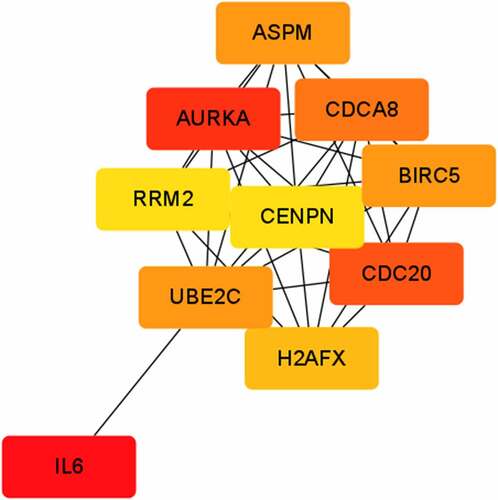
Figure 2. The ceRNAs network in IUA. Diamond-shaped nodes represent miRNAs; Triangle nodes represent lncRNAs; Circular nodes represent mRNAs; Every edge indicates target interaction.
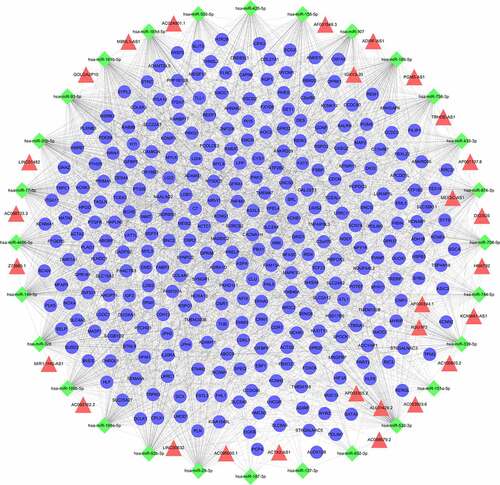
Figure 3. Kyoto Encyclopedia of Genes and Genomes (KEGG) pathway and Gene Ontology (GO) term enrichment analysis of differentially expressed genes (DEGs). (a) All enriched KEGG pathways of DEGs in ceRNAs network. (b) TOP20 enriched GO biological processes of DEGs in ceRNAs network.
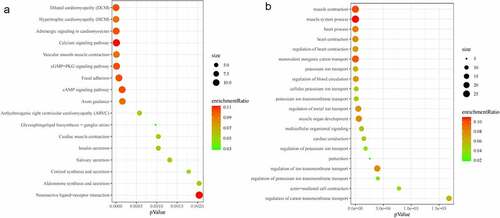
Figure 4. Linear regression of ceRNAs’ expression level. Dashed lines represent 95% confidence interval. (a) ADIRF-AS1 vs MAPK10 (hypertrophic cardiomyopathy, n = 22). (b) ADIRF-AS1 vs SLC6A9 (systemic sclerosis, n = 91). (c) ADIRF-AS1 vs HLF (systemic sclerosis, n = 91). (d) ADIRF-AS1 vs AHNAK2 (systemic sclerosis, n = 91). (e) MBNL1-AS1 vs MYL3 (liver fibrosis, n = 124). (E) MBNL1-AS1 vs POPDC3 (liver fibrosis, n = 124). (f) MBNL1-AS1 vs PLN (liver fibrosis, n = 124).