
Figures & data
Figure 1. lncRNA PURPL presented a high profile in GC tissues and cells The tumor tissues and normal adjacent tissues of 21 patients suffering from gastric cancer were harvested. A. PURPL expression in the patients’ tumor tissues and normal adjacent tissues was determined by RT-PCR. B. FISH examined PURPL in GC tissues and normal adjacent tissues. C. RT-PCR confirmed PURPL expression in the normal gastric epithelial cell line GES-1 and gastric cell lines AGS, GC9811-P, MKN-45, and HSC-39. ***P < 0.001. N = 3.
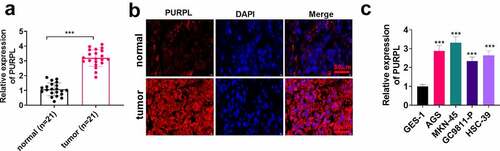
Figure 2. lncRNA PURPL overexpression boosted GC development in vitro AGS and MKN-45 cells were transfected along with lncRNA PURPL overexpression plasmid. A. RT-PCR ascertained the profile of PURPL in AGS and MKN-45 cells. B. Colony formation assay monitored cell proliferation. C. Transwell checked cell migration and invasion. D. Flow cytometry tracked apoptosis. E. Western blot verified the profiles of apoptosis-concerned proteins Bax, Bcl2, and Caspase3. *P < 0.05, **P < 0.01, ***P < 0.001 (vs. the vec group), N = 3.
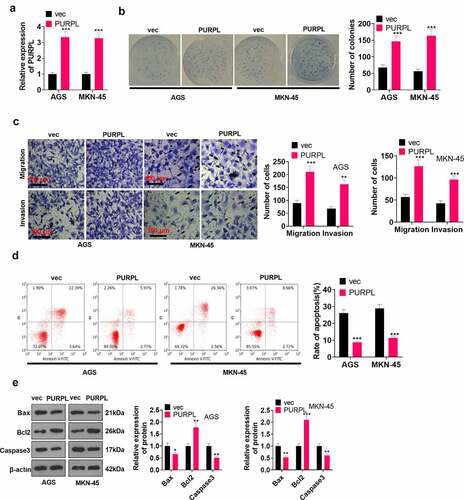
Figure 3. lncRNA PURPL overexpression facilitated GC cell growth in vivo AGS cells were transfected along with lncRNA PURPL overexpression plasmid and Vector and then subcutaneously inoculated into the back of the mice on the right and posterior sides to engineer a xenograft tumor model. A. The tumor volume. B. Tumor images displaying the tumor tissues on the 35th day. C. The tumor weight. D. IHC evaluated Ki67, the proliferation indicator. E. TUNEL tracked apoptosis in the tumor tissues. ***P < 0.001 (vs. the vec group), N = 5.
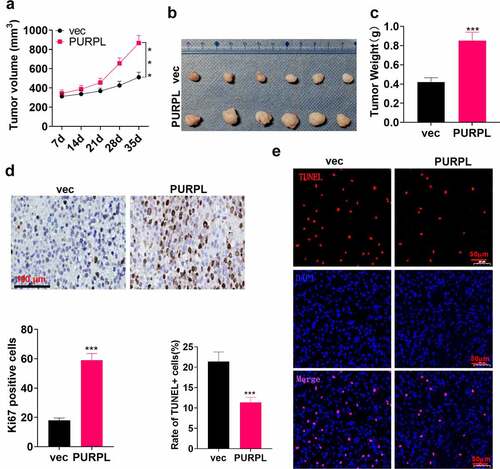
Figure 4 lncRNA PURPL targeted miR-137 and augmented ZBTB7A’s expression The bioinformatics database ENCORI (http://starbase.sysu.edu.cn/index.php) predicted the targeted correlation between PURPL and miR-137. B. Dual luciferase activity assay corroborated that miR-137 was targeted by PURPL. C-D. RT-PCR ascertained miR-137 and ZBTB7A expressions in AGS and MKN-45 cells with PURPL overexpression. E-F. RT-PCR determined miR-137 and ZBTB7A expressions in the tumor tissues. G. Immunofluorescence measured ZBTB7A in the tumor tissues. NSP>0.05, **P < 0.01, ***P < 0.001 (vs. the vec group), N = 3.
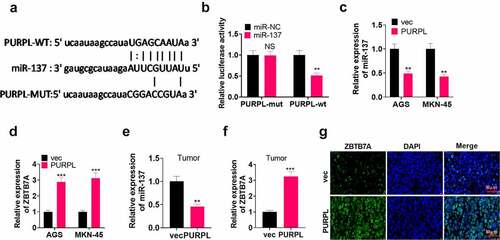
Figure 5. lncRNA PURPL influenced GC progression via miR-137/ZBTB7A axis regulation miR-137 mimics (miR-137) or si-ZBTB7A was transfected into AGS cells with PURPL overexpression. A-C. RT-PCR confirmed the profiles of PURPL, miR-137, and ZBTB7A in AGS cells. D. Colony formation assay examined proliferation. E. Transwell monitored cell migration and invasion. F. Flow cytometry determined the apoptosis rate of AGS cells. G. The profiles of apoptosis-concerned proteins Bax, Bcl2, and Caspase3 were figured out through Western blot. ** P < 0.01, ***P < 0.001 (vs. the vec group), ##P < 0.01, ###P < 0.001 (vs. the PURPL group). N = 3.
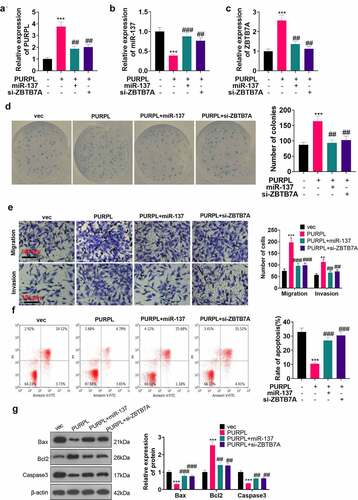
Figure 6. lncRNA PURPL activated the ZBTB7A/PI3K/AKT/NF-κB pathway Western blot determined the profile of the PI3K/AKT/NF-κB pathway in the nude mouse tumor tissues. B. Immunofluorescence assessed PI3K/AKT/NF-κB in the tumor tissues. C. Western blot evaluated the PI3K/AKT/NF-κB pathway in AGS cells transfected along with PURPL overexpression, miR-137 mimics, or si-ZBTB7A. ***P < 0.001 (vs. the vec group), # P < 0.05 (vs. the PURPL group). N = 3.
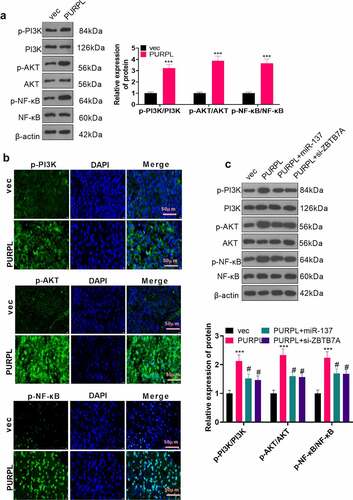
Figure 7. PI3K and NF-κB inhibition impaired the lncRNA PURPL-mediated cancer-promoting function The PI3K inhibitor LY294002 (Cat.No: HY-10108) (10 μM) and the NF-κB inhibitor JSH-23 (Cat.No: HY-13982) (30 μM) were administered to the AGS model with PURPL overexpression, respectively. A. Colony formation assay examined cell proliferation in each group. B. Transwell analyzed cell migration and invasion. C. Flow cytometry determined the apoptosis rate of AGS cells. D. Western blot confirmed the profiles of apoptosis-concerned cells Bax, Bcl2, and Caspase3. E. Western blot verified the protein profile of the PI3K/AKT/NF-κB pathway. **P < 0.01, ***, P < 0.001 (vs. the vec group), # P < 0.05, ## P < 0.01, ### P < 0.001 (vs. the PURPL group), N = 3.
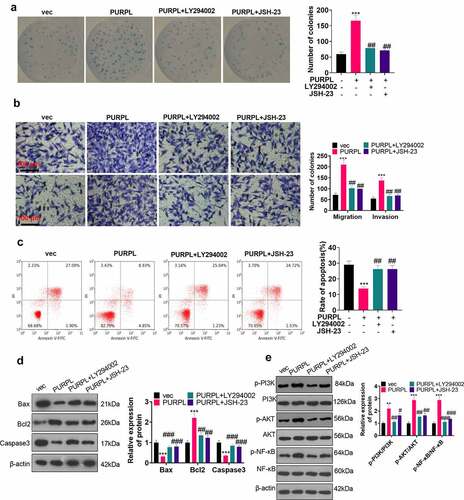
Figure 8. Down-regulation of the ZBTB7A/PI3K/AKT/NF-κB pathway mitigated PURPL’s level. si-ZBTB7A was transfected into AGS cells. A-B. RT-PCR examined PURPL and miR-137. C-F. LY294002 (10 μM) and JSH-23 (30 μM) were given to AGS cells for PI3K or NF-κB inhibition. RT-PCR assessed PURPL and miR-137. ***P < 0.001. N = 3.
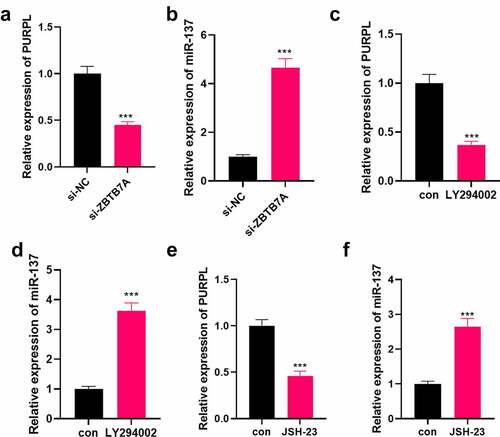
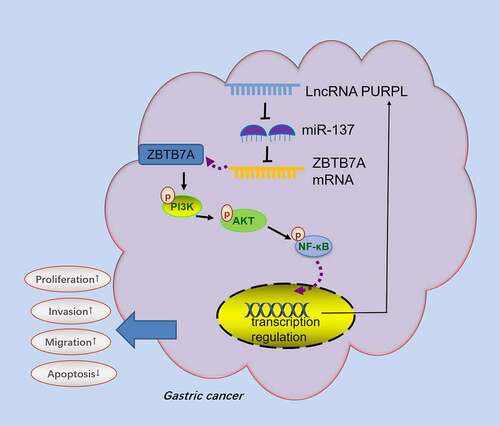
Figure 9. Schematic diagram of PURPL-miR-137-ZBTB7A/PI3K/AKT/NF-κB axis in GC development.
Data Availability Statement
The data sets used and analyzed during the current study are available from the corresponding author on reasonable request.