Figures & data
Table 1. Primer sequences of RT-qPCR
Figure 1. Up-regulated expression of miR-9-5p and CXCR4 are found in NSCs under propofol treatment. (a) The viability of NSCs after 6 h of propofol treatment was examined by the CCK-8 assay kit. (b and c) The mRNA expression of miR-9-5p and CXCR4 in NSCs after 6 h of propofol treatment was examined by RT-qPCR. (d) The protein bands of CXCR4 and β-actin and protein expression of CXCR4 in NSCs after 6 h of propofol treatment were examined by Western blot analysis. (e) The protein expressions of Bax, caspase-3, and Bcl-2 were measured by Western blot analysis. The experiment was repeated three times; the significance of difference between means was analyzed for multiple comparisons by the analysis of variance; the data between two groups was analyzed using the student’s t-test, *P < 0.05; **P < 0.01, ***P< 0.001, ****P< 0.0001; CCK-8 kit, Cell Counting Kit-8; NSCs, neural stem cells; CXCR4, CXC chemokine receptor-4; miR-9-5p, microRNA-9-5p; RT-qPCR, reverse transcription-quantitative polymerase chain reaction; Bax, Bcl-2-associated X protein; Bcl-2, B-cell lymphoma 2.
Figure 2. miR-9-5p dependent induction of CXCR4 by propofol. (a and b) The expression of miR-9-5p and CXCR4 were examined by RT-qPCR. (c) The protein bands of CXCR4 and β-actin and protein expression of CXCR4 were examined by Western blot analysis. The experiment was repeated three times; the significance of the difference between means was analyzed for multiple comparisons by the analysis of variance; the data between two groups were analyzed using the student’s t-test, **P < 0.01, ***P < 0.001.
Figure 3. miR-9-5p promotes the apoptosis of propofol-treated NSCs. (a) The viability of propofol-treated NSCs after the overexpression of miR-9-5p was examined by a CCK-8 assay. (b) The effect of miR-9-5p overexpression on apoptosis of propofol-treated NSCs was examined by Hoechst staining. (c) the protein expression of Bax, caspase-3and Bcl-2 measured by Western blot analysis. The experiment was repeated three times; the significance of the difference between means was analyzed for multiple comparisons by the analysis of variance; the data between two groups were analyzed using the student’s t-test, *P< 0.05, ***P< 0.001, ****P < 0.0001.
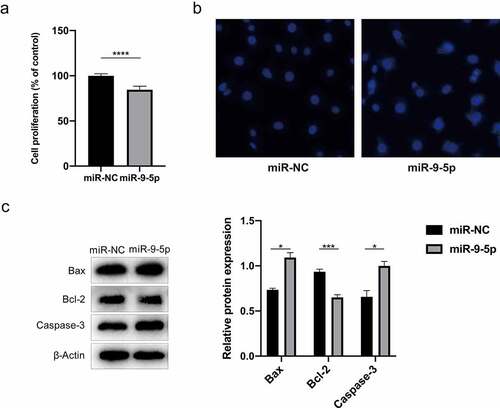
Figure 4. CXCR4 silencing inhibits the apoptosis of propofol-treated NSCs. (a) The mRNA expression of CXCR4 after CXCR4 silencing was examined by RT-qPCR. (b) The protein expression of CXCR4 after CXCR4 silencing was examined by Western blot analysis. (c) Viability of propofol-treated NSCs after CXCR4 silencing was examined by the CCK-8 assay kit. (d) The apoptosis of propofol-induced NSCs after CXCR4 silencing was examined by Hoechst staining. (e) The protein expressions of Bax, caspase-3, and Bcl-2 were measured by Western blot analysis. The experiment was repeated three times; the significance of the difference between means was analyzed for multiple comparisons by the analysis of variance; the data between two groups were analyzed using the student’s t-test, **P< 0.01, ***P< 0.001, ****P< 0.0001.
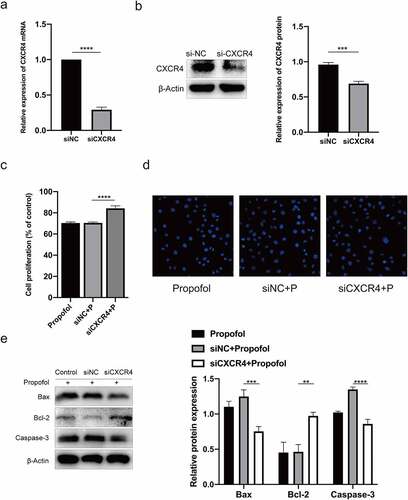
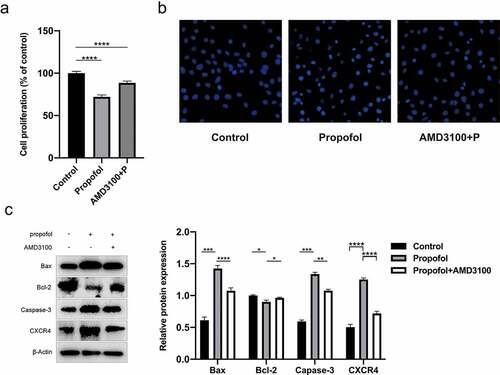
Figure 5. Pretreatment of AMD3100 promotes the inhibition of apoptosis in propofol-treated NSCs. (a) Viability of propofol-induced NSCs after AMD3100 pretreating was examined by the CCK-8 assay kit. (b) The apoptosis of propofol-induced NSCs after AMD3100 pretreating was examined by Hoechst staining. (c) The protein expressions of CXCR4, Bax, caspase-3, and Bcl-2 were measured by Western blot analysis. The experiment was repeated three times; the significance of the difference between means was analyzed for multiple comparisons by the analysis of variance ; the data between two groups were analyzed using the student’s t-test, *P < 0.05, **P < 0.01, ***P < 0.001, ****P < 0.0001.