
Figures & data
Table 1. The primer sequence of each gene
Figure 1. miR-211-5p was knocked down in the plasma of PMOP patients and positively correlated with plasma Vit-D and BMD levels.
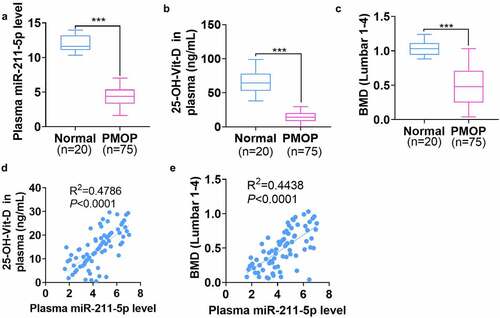
Figure 2. miR-211-5p overexpression enhanced hMSC osteogenic differentiation.
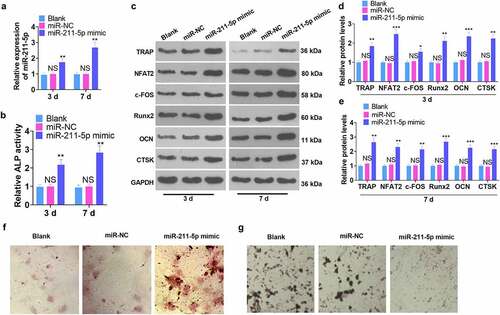
Figure 3. miR-211-5p knockdown hampered hMSC osteogenic differentiation.
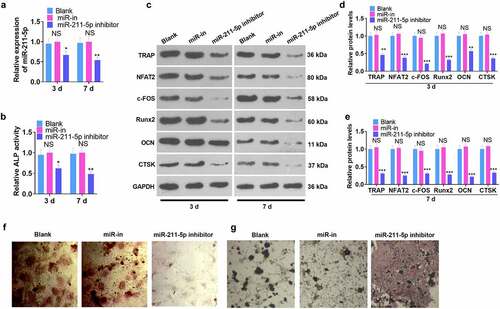
Figure 4. DUSP6 was targeted by miR-211-5p.
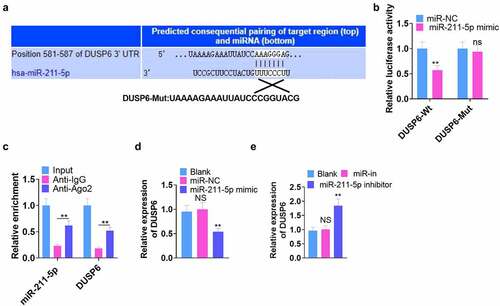
Figure 5. DUSP6 overexpression dampened the osteogenic differentiation of hMSCs.
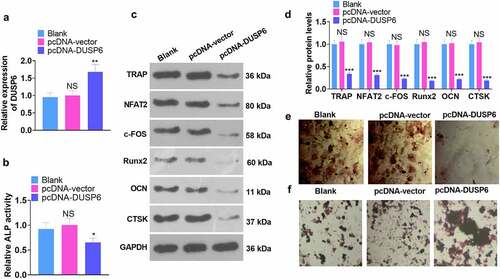
Figure 6. miR-211-5p overexpression abated the DUSP6-mediated inhibition of hMSC osteogenic differentiation.
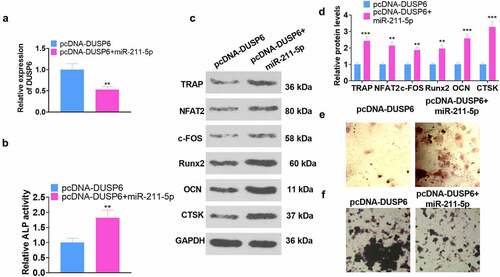
Figure 7. Regulation of the ERK-Smad/β-catenin pathway by miR-211-5p and DUSP6.
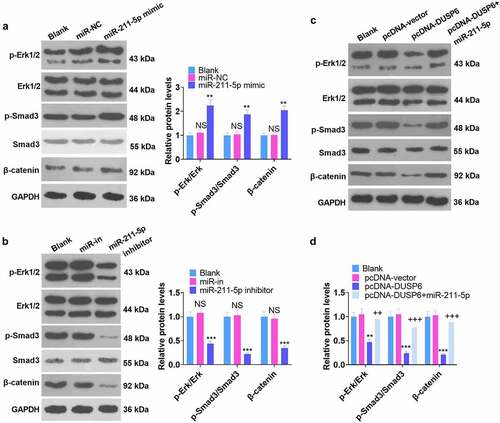
Figure 8. ERK pathway activation impeded the DUSP6-mediated inhibition of hMSC osteogenic differentiation.
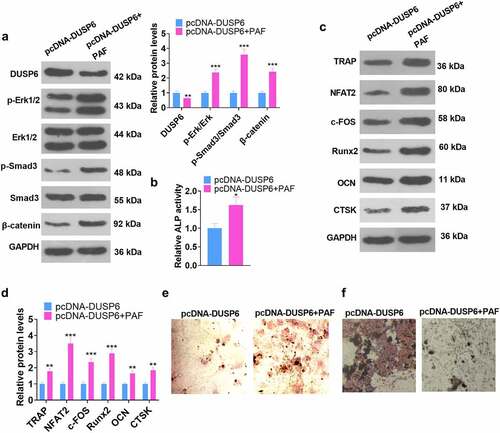
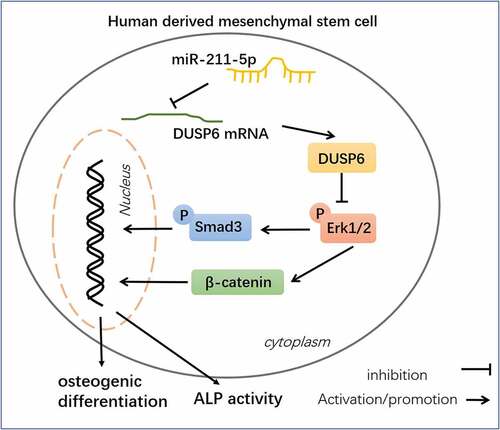
Figure 9. Schematic diagram of miR-211-5p in hMSC osteogenic differentiation.
Data Availability Statement
The data sets used and analyzed during the current study are available from the corresponding author on reasonable request.