Figures & data
Figure 1. A flowchart of the study.
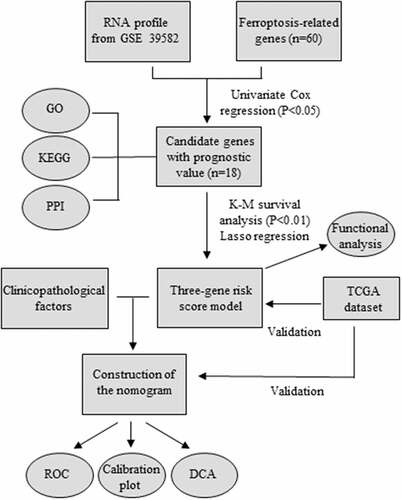
Figure 2. Identification of optimal prognostic ferroptosis-related genes in GSE 39582. (a) Univariate Cox regression analysis of gene expression and overall survival. (b) Gene ontology (GO) terms and Kyoto Encyclopedia of Gene and Genomes (KEGG) pathways of the 18 candidate genes. (c) Interaction among the candidate genes analyzed through protein-protein interactions (PPI) network. (d-f) Kaplan-Meier survival curves for the overall survival in the high and low expression group of ACACA (d), GSS (e), and NFS1 (f) in GSE 39582.
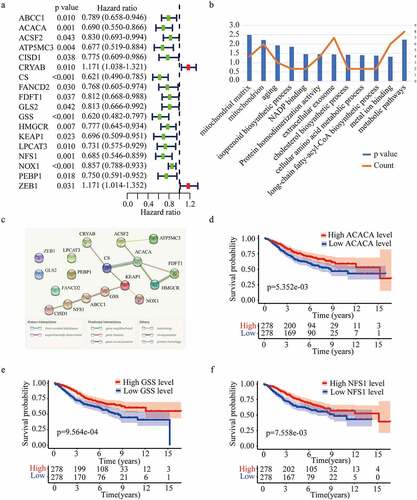
Figure 3. Construction and validation of the three-gene risk score model. (a-b) Principal component analysis plot of GSE 39582 (a) and TCGA dataset (b). (c-d) Kaplan-Meier survival curves for the overall survival in high and low-risk group in GSE 39582 (c) and TCGA dataset (d). (e-f) The distribution of risk score, overall survival status, and gene expression profile in GSE 39582 (e) and TCGA dataset (f).
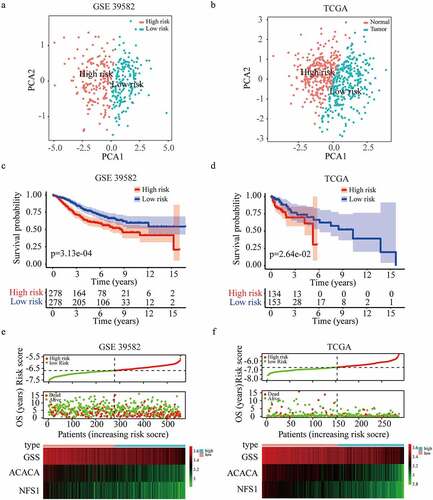
Figure 4. Prognostic performance of the risk score model. (a-b) Univariate analysis Cox regression analysis of the risk score model and clinico-pathological factors in GSE 39582 (a) and TCGA dataset (b). (c-d) Multivariate analysis Cox regression analysis of the risk score model and clinicopathological factors in GSE 39582 (c) and TCGA dataset (d).
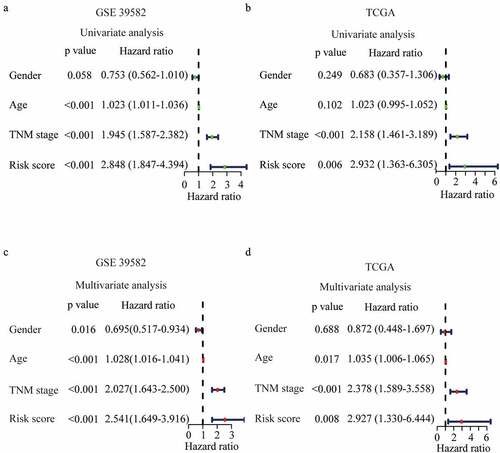
Figure 5. Development and validation of the nomogram. (a) Development of the nomogram. (b-c) ROC curves of the nomogram, gender, age, and TNM stage at 3 (b) and 5 years (c) in GSE 39582. (d-e) ROC curves of the nomogram, gender, age, and TNM stage at 3 (d) and 5 years (e) in the TCGA validation dataset. (f-i) Calibration plots for 3 (f) and 5 years (g) overall survival prediction in GSE 39582, and for 3 (h) and 5 years (i) overall survival prediction in TCGA validation dataset.
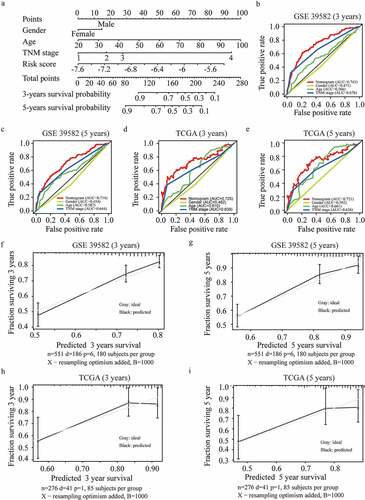
Figure 6. Pathway analysis and ssGSEA scores comparison between the high and low-risk groups. (a-b) GO terms (a) and KEGG pathway analysis in GSEA enrichment. (c-d) The scores of 16 immune cells and 13 immune-related functions in high and low-risk group in GSE 39582 (c) and TCGA dataset (d).
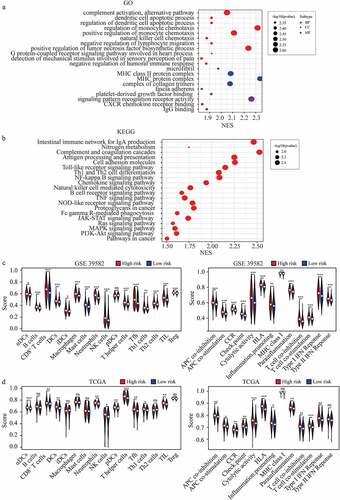
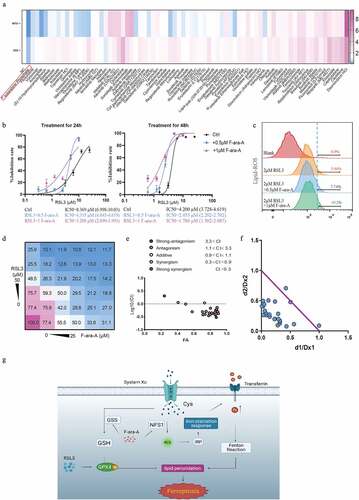
Figure 7. Higher FRGs signature predicts more sensitivity to ferroptosis-inducer. (a) The expression of ACACA, NFS1 and GSS in SW480, Caco2 and NCM460 cells (GAPDH as acommon reference). (b) Cell viability was assayed by CCK-8 kit after treatment with RSL3 (0, 1.5625, 3.125, 6.25, 12.5, 25, and 50 μM) for 18 or 36 hrs. (c) Knockdown efficiency of ACACA, NFS1, and GSS in Caco2 cells transfected with siRNAs. (d) Cell viability of Caco2 cells transfected with siCtrl, siACACA, siGSS or siNFS1 for 48 hrs and then treated with RSL3 (0, 1.5625, 3.125, 6.25, 12.5, 25, and 50 μM) for 18 or 36 hrs. (e) Cell viability of the indicated CRC cells after treatment with RSL3 in the absence or presence of Z-VAD-FMK(Z-VAD), Necrostatin-1(Nec1), ferro-statin-1(Fer-1), and Deferoxamine Mesylate (DFO) for 24 hrs (n = 5, *p < 0.05). (f, h) Quantitative polymerase chain reaction (qPCR) analysis of the PTGS2 expression in the indicated cells treated with RSL3 (4 or 8 μM) for 24 hrs. (g, i) Identification by flow cytometry of C11-BODIPY fluorescence in SW480, Caco2 or NCM460 cells (g), and in Caco2 cell transfected with siCtrl, siGSS or siNFS1 (i) after treatment with RSL3 (2 or 4 μM) for 24 hrs.
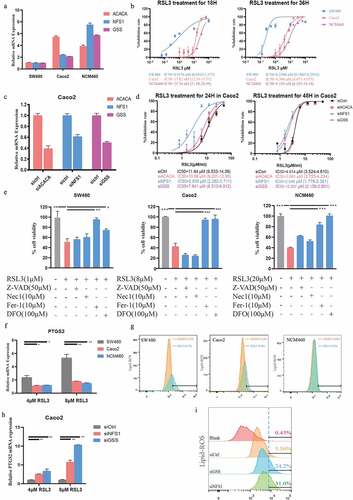
Figure 8. Fludarabine phosphate has a synergistic effect in combination with RSL3. (a)Heat map of mRNA expression levels of NFS1 and GSS in Caco2 cell lines following treatment of 78 FDA-approved drugs for 48hours (The working concentrations were determined based on the Selleck website). (b) Cell viability of Caco2 cells after treatment of 0.5μM or 1μM Fludarabine Phosphate combined with RSL3 (0, 0.625, 1.25, 2.5, 5 and 10μM) for 24 or 48 hr. (c) Identification by flow cytometry of C11-BODIPY fluorescence in Caco2 treated with 2μM RSL3 combined with 0.5μM or 1μM Fludarabine Phosphate for 24 hr. (d) Heatmap showing the cell viability of Caco2 cell after RSL3 and Fludarabine Phosphate combination treatment. (e)Synergy of RSL3 and the Fludarabine Phosphate assessed by TING-CHAO CHOU combination index (CI). The x-axis represents inhibi-tion effect, and the yaxis represents log10(CI, Combination Index). ACI of less than 1 means that the two drugs have asynergistic effect. (f) The horizontal and vertical co-ordinates represent the fractional inhibition effect of the two drugs (Dx1 (RSL3), and Dx2 (Fludarabine Phosphate)) standardized concentrations alone. The purple line dis-played is the line of additivity. (g) The working model depicting the synergistic effect of RSL3 and the Fludarabine Phosphate on CRC cells.