Figures & data
Table 1. Sequences for si-PTPRF
Table 2. The primers for PCR
Figure 1. Expression of miR-647 and PTPRF in LO2 and HCV cell lines. (a) The miR-647 expression level in LO2 and HCV-huh7.5 cells was analyzed by qRT-PCR. (b) The PTPRF expression level in LO2 and HCV-huh7.5 was analyzed by qRT-PCR. All the data above are expressed as the mean ± S.D of three independent experiments. **P < 0.01, ***P < 0.001.
Figure 2. Effects of miR-647 expression level on the biology of HCV-huh7.5 cells. (a). The expression of miR-647 was detected by qRT-PCR after miR-647 mimic or inhibitor transiently transfected into HCV-huh7.5 cells. (b). CCK-8 assay was used to measure cell proliferation after transfection. (c). The monoclonal ability of cells was tested by cell cloning assay. (d) Cell migration and invasion ability after transfection. All the data above are expressed as the mean ± S.D of three independent experiments. **P < 0.01, ***P < 0.001.
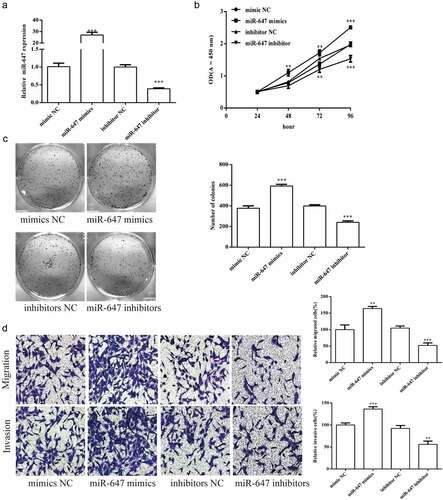
Figure 3. PTPRF gene was targeted by miR-647. (a). The miR-647 sequences were predicted to interact with PTPRF 3ʹ-UTR was displayed. Luciferase activity in HCV-huh7.5 cells transfected with control miRNA, or miR-647. Luciferase activity was normalized by the ratio of firefly and Renilla luciferase signals. (b). The expression of PTPRF protein in transfected cells was detected by Western blot analysis. All the data above are expressed as the mean ± S.D of three independent experiments. *P < 0.05, **P < 0.01, ***P < 0.001.
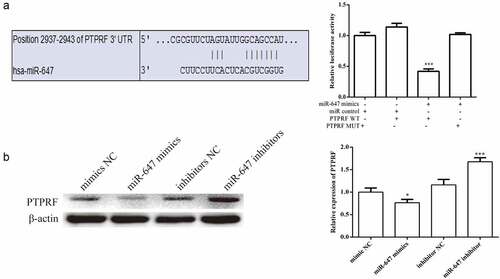
Figure 4. Effects of miR-647 or PTPRF on Erk signaling pathway in HCV-huh7.5 cells. (a). The effects of miR-647 expression on Erk pathway was determined by Western blot in HCV-huh7.5 cells. (b). The expression of PTPRF protein was detected by Western blot. (c). The effects of PTPRF expression on Erk pathway were determined by Western blot in HCV-huh7.5 cells. All the data above are expressed as the mean ± S.D of three independent experiments. *P < 0.05, **P < 0.01, ***P < 0.001.
Figure 5. Effects of PTPRF expression on the biological function of HCV-huh7.5 cells. (a). The expression of PTPRF was detected by qRT-PCR after PTPRF overexpression or knockdown transiently transfected into HCV-huh7.5 cells. (b). CCK-8 assay was used to measure cell proliferation after transfection. (c). The monoclonal ability of cells was tested by cell cloning assay. (d). Cell migration and invasion ability after transfection. All the data above are expressed as the mean ± S.D of three independent experiments. **P < 0.01, ***P < 0.001.
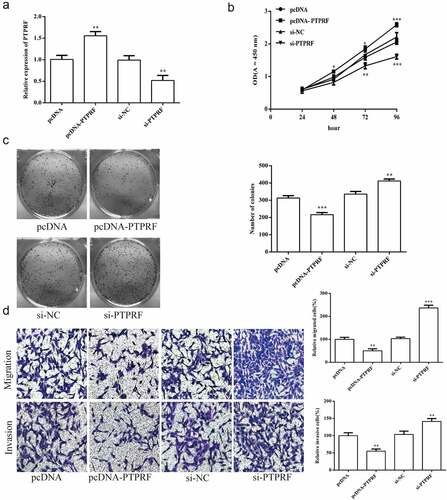
Figure 6. miR-647 regulates cell biological activity by targeting PTPRF. (a). CCK-8 assay was used to measure cell proliferation after transfected with miR-647 inhibitor, negative agent, or miR-647 inhibitor + si-PTPRF. (b). The monoclonal ability of cells was tested by cell cloning assay. (c). Cell migration and invasion ability after transfection. All the data above are expressed as the mean ± S.D of three independent experiments. **P < 0.01, ***P < 0.001.
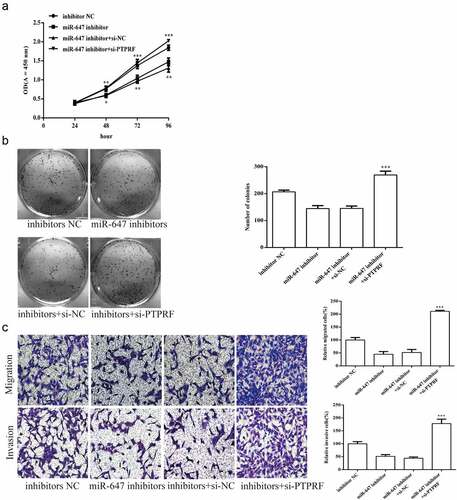
Figure 7. miR-647 can facilitate the Erk1/2 signaling pathway by targeting PTPRF. According to groups: inhibitor NC, the miR-647 inhibitor, miR-647 inhibitor +si-NC and miR-647 inhibitor + si-PTPRF were transfected into HCC-Huh7.5 cells. The protein expression levels of p-Erk1/2, p-Myc, p-MNK1, and Erk1/2 were determined by Western blot. All the data above are expressed as the mean ± S.D of three independent experiments. **P < 0.01, ***P < 0.001.