Figures & data
Figure 1. OPA3 upregulation was associated with poor prognosis of patients with HCC A. Characterization of OPA3 mRNA expression in HCC tissues from TCGA (n = 369), HCC adjacent normal tissues from TCGA (n = 50) and normal liver tissues (n = 110) from GTEx. Welch’s unpaired t-test was performed. B-C. K-M survival analysis of the difference in OS (b) and PFS (c) between HCC cases with high and low OPA3 mRNA expression. Patients were separated into two groups according to the Youden Index in ROC analysis for death detection. Log-rank (Mantel-Cox) test was performed. D. A wave diagram showing the exonic expression of three OPA3 transcripts in HCC tissues from TCGA (n = 369) and normal liver tissues (n = 110) from GTEx. E-F. Characterization of OPA3 isoform expression (ENST00000323060.3 and ENST00000263275.4), in terms of isoform percentage (e) and normalized isoform expression (f). Welch’s unpaired t-test was performed. G. IHC staining of OPA3 in human HCC tissues. Images were retrieved from the HPA via the following links: https://www.proteinatlas.org/ENSG00000125741-OPA3/pathology/liver+cancer#ihc.
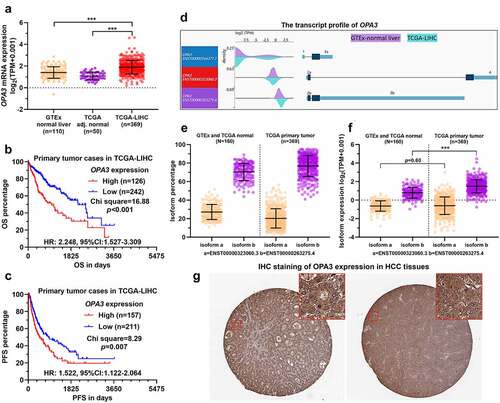
Figure 2. OPA3 upregulation increases HCC tumor growth in-vitro and in-vivo A-B. Characterization of OPA3 mRNA expression by qRT-PCR (a) and protein expression by Western blotting (b) in normal liver parenchyma cells (CP-H043), and HCC cell lines, including Huh1, HLF, JHH2, and HepG2. One-way ANOVA with post-hoc Dunnett’s multiple comparisons test was performed by setting CP-H043 as the control group. C-D. OPA3 mRNA expression (c) and protein expression (d) in HLF and JHH2 cells after lentiviral mediated OPA3 knockdown (36 h) and transient (36 h) puromycin selection. For detecting the difference in mRNA expression, one-way ANOVA with post-hoc Dunnett’s multiple comparisons test was performed by setting shNC as the control group. E-F. CCK-8 assay was performed to measure the viability of HLF (e) and JHH2 (f) cells after lentiviral mediated OPA3 knockdown. *, comparison between shNC and shOPA3#1; #, comparison between shNC and shOPA3#2. Welch’s unpaired t-test was performed. G-J. Representative images and quantitation of colony formation assay was performed to measure the colony formation of HLF (E) and JHH2 (F) cells after lentiviral mediated OPA3 knockdown. Welch’s unpaired t-test was performed. K-Q. Representative images (k and o), growth curves (l and p) and IHC staining of Ki-67 (m and q) of xenograft tumors derived from HLF (k-m) and JHH2 (o-q) cells after lentiviral mediated OPA3 knockdown. Welch’s unpaired t-test was performed. Data are shown as means ± SD, n = 3 (except for animal studies, where n = 6). Scale bar = 50 μm. ** and ##, p < 0.01; *** and ### p < 0.001.

Figure 3. OPA3 expression was transcriptionally activated by MYBL2 in HCC cells A. A heatmap showing the expression profiles of potential transcription factors and chromatin regulators with binding in the promoter region of OPA3 in HepG2 cells, based on ChIP-seq data (GSM1010876) recoded in the Cistrome Data Browser. B. The ChIP-Seq data (GSM1010876) from the Cistrome browser showed the binding of MYBL2 to the OPA3 promoter in HepG2 cells. C. Characterization of MYBL2 mRNA expression in HCC tissues from TCGA (n = 369), HCC adjacent normal tissues from TCGA (n = 50) and normal liver tissues (n = 110) from GTEx. Welch’s unpaired t-test was performed. D. Pearson’s analysis showing the correlation between expression of OPA3 and MYBL2 in normal liver and HCC tissues. E. IF staining of MYBL2 (blue) expression in HLF and JHH2 cells. F. A schematic image showing OPA3 promoter structure, MYBL2 binding motif, the predicted binding site and the position of primers designed for ChIP-qPCR assay. The mutant design for the dual-luciferase assay was also provided. G-I. MYBL2 and OPA3 mRNA expression (g-h) and protein expression (i) in HLF and JHH2 cells after lentiviral mediated MYBL2 knockdown (36 h) and transient (36 h) puromycin selection. Welch’s unpaired t-test was performed. J-K. ChIP-qPCR was performed to examine the relative enrichment (% of input) of the OPA3 promoter fragments (amplicon 1 and 2) in the DNA samples immunoprecipitated by anti-MYBL2 in HLF (j) and JHH2 (k) cell lysates. Welch’s unpaired t-test was performed. L-M. Dual-luciferase assay was conducted to measure the luciferase expression of pGL3-WT carrying wild-type OPA3 promoter and pGL3-MT reporter plasmids carrying mutant OPA3 promoter in HLF (l) and JHH2 (m) with or without MYBL2 knockdown. Welch’s unpaired t-test was performed. Data are shown as means ± SD, n = 3. ***p < 0.001.
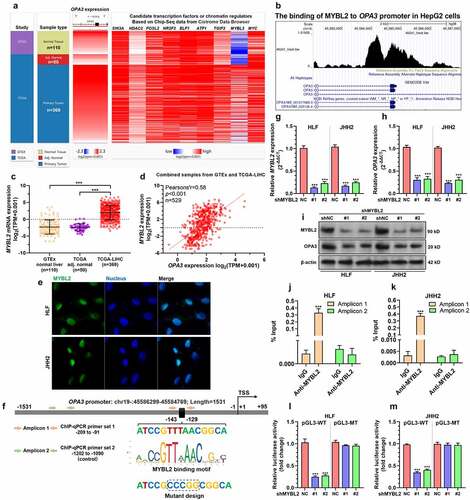
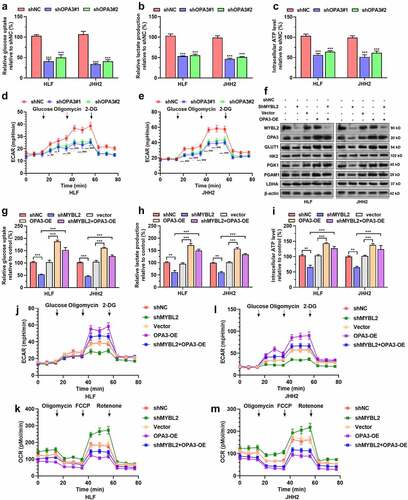
Figure 4. The MYBL2-OPA3 axis modulates aerobic glycolysis of HCC cells A-E. Measurement of glucose uptake (a), lactate production (b), intracellular ATP levels (c), and ECAR (d-e) of HLF and JHH2 cells with or without OPA3 knockdown. Welch’s unpaired t-test was performed. *, comparison between shNC and shOPA3#1; #, comparison between shNC and shOPA3#2. F. MYBL2, OPA3, GLUT1, HK2, PGK1, PGAM1 and LDHA protein expression in HLF and JHH2 cells after lentiviral mediated MYBL2 knockdown (36 h) and transient (36 h) puromycin selection alone or in combination with OPA3-OE. G-M. Measurement of glucose uptake (g), lactate production (h), intracellular ATP levels (i), ECAR (j and l) and OCR (k and m) of HLF and JHH2 cells with lentiviral mediated MYBL2 knockdown alone or in combination with OPA3-OE. Welch’s unpaired t-test was performed. * and #, p < 0.05; ** and ##, p < 0.01; *** and ### p < 0.001.