Figures & data
Table 1. The clinicopathological features for HCC patients
Figure 1. lncRNA LINC01194 is highly expressed in HCC. (a) RT-qPCR analysis of lncRNA LINC01194 in HCC tumor tissues, with non-tumor tissues serving as the negative control. (b) RT-qPCR analysis of lncRNA LINC01194 in Huh-7 and HCCLM3 HCC cells, with THLE2 cells serving as the negative control. *P < 0.01 vs. normal adjacent tissue; ##P < 0.01 vs. THLE2 cells.
Figure 2. lncRNA LINC01194 functions as an miR-655-3p sponge in HCC cells. (a) StarBase software predicted the lncRNA LINC01194 on miR-655-3p 3ʹUTR. (b) miR-655-3p expression in the control mimic or miR-655-3p mimic transfected 293 T cells. (c) Direct binding relationship between lncRNA LINC01194 and miR-655-3p were confirmed using a dual-luciferase gene reporter gene assay. **P < 0.01 vs. control mimic.
Figure 3. miR-655-3p was downregulated in HCC tissues and cells. miR-655-3p expression in (a) pairs of tumor and matched non-tumor tissues from HCC patients, and (b) Huh-7 and HCCLM3 HCC cells, with THLE2 cells serving as the negative control were determined using RT-qPCR. **P < 0.01 vs. normal adjacent tissue; ##P < 0.01 vs. THLE2 cells.
Figure 4. LINC01194 negatively regulates miR-655-3p in Huh-7 cells. (a) The efficiency of LINC01194 knockdown was verified using RT-qPCR. Detection of miR-655-3p levels following transfection with miR-655-3p inhibitor (b), and LINC01194 siRNA and miR-655-3p co-transfection group (c) using RT-qPCR. **P < 0.01 vs. control siRNA; ##P < 0.01 vs. inhibitor control; &&P < 0.01 vs. LINC0119-siRNA + control inhibitor. miR, microRNA.
Figure 5. lncRNA LINC01194 knockdown inhibits HCC cell migration and invasion via miR-655-3p. (a) CCK-8 assay was performed to check Huh-7 cell growth. (b-d) Determination of cyclin D1 and MMP9 levels using Western blotting and RT-qPCR analysis, respectively. (e-h) Migrated and invaded Huh-7 cells were analyzed using a transwell assay. **P < 0.01 vs. control siRNA; ##P < 0.01 vs. LINC0119-siRNA + control inhibitor.
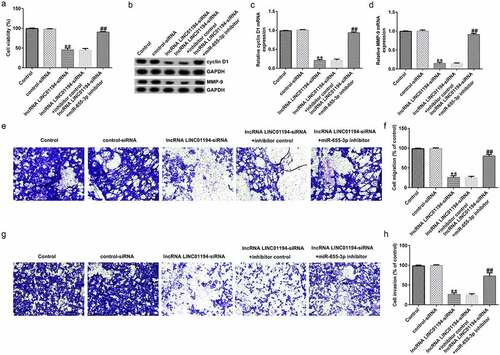
Figure 6. lncRNA LINC01194 knockdown promotes HCC cell apoptosis by regulating miR-655-3p. (a and b) Flow cytometry analysis of apoptotic Huh-7 cells. (c) Western blotting analysis of apoptosis-related proteins Bax and Bcl-2 levels. (d) Semi-quantitative analysis of Bax, Bcl-2, and Bcl-2/Bax expression. **P < 0.01 vs. control siRNA; ##P < 0.01 vs. LINC0119-siRNA + control inhibitor.
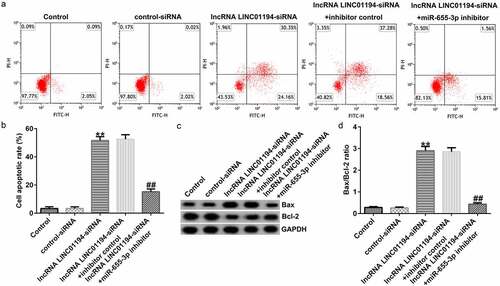
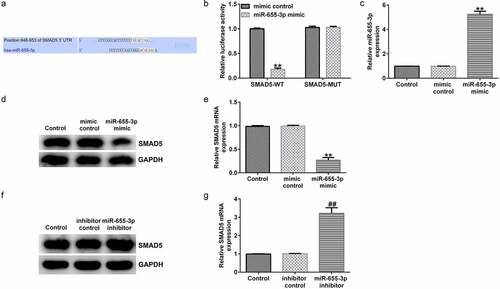
Figure 7. miR-655-3p negatively targets SMAD5 in Huh-7 cells. (a) TargetScan software predicted the miR-655-3p on SMAD5 3ʹUTR. (b) A dual-luciferase reporter gene assay was conducted to verify the binding sites between miR-655-3p and SMAD5. (c) miR-655-3p mimic efficiency was verified using RT-qPCR assay. (d and e) SMAD5 expression was evaluated using RT-qPCR and Western blotting in miR-655-3p overexpression Huh-7 cells. (f and g) RT-qPCR and Western blotting analysis of SMAD5 level in miR-655-3p inhibitor transfected Huh-7 cells. **P < 0.01 vs. mimic control; ##P < 0.01 vs. control inhibitor.