Figures & data
Figure 1. Upregulation of circZNF652 in GBM tissues and cell lines, and associates with aggravate progression in GBM. (a) and (b) The expression of circZNF652 in GBM tissues, adjacent normal tissues, I-II clinical stage, III-IV clinical stage. (c) The overall survival curve of high and low circZNF652 expression GBM patients. (d) The expression of circZNF652 in NHA, A172, U251, LN229, U87 cells. ***P < 0.001.
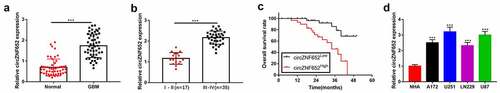
Figure 2. Stability and cellular localization of circZNF652 in GBM cells. (a) and (b) The mRNA expression of circZNF652 and linear ZNF652 was examined using RT-qPCR after U172 and U87 cells treatment with RNase R. (c) and (d) The mRNA expression of circZNF652 and linear ZNF652 was examined using RT-qPCR after U172 and U87 cells treatment with actinomycin D. (e) and (f) The mRNA expression of U6, GAPDH, circZNF652 of nucleus and cytoplasm in U172 and U87 cells was detected using RT-qPCR. (g)-(k) The protein levels of lamin B and α-tublin of nucleus and cytoplasm in U172 and U87 cells was determined using Western blotting. ***P < 0.001.
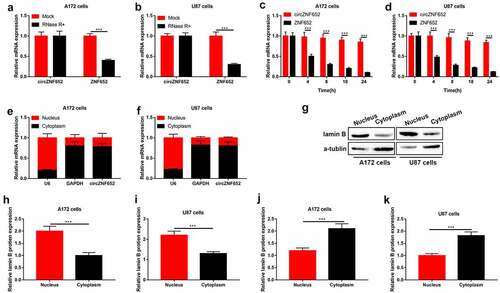
Figure 3. Knockdown of circZNF652 suppressed GBM cell growth, migration, invasion, and EMT process. (a) and (b) Cell viability was examined using CCK-8 assay after A172 and U87 cells were transferred with si-NC or si-circZNF652. (c) and (d) The colony formation number was measured using colony formation assay after A172 and U87 cells were transferred with si-NC or si-circZNF652. (e) and (h) Cell migration and invasion were determined using wound healing assay and transwell assay after A172 and U87 cells were transferred with si-NC or si-circZNF652. (i)-(l) The protein level of E-cadherin, N-cadherin, vimentin was detected using Western blotting after A172 and U87 cells were transferred with si-NC or si-circZNF652. **P < 0.01, ***P < 0.001.
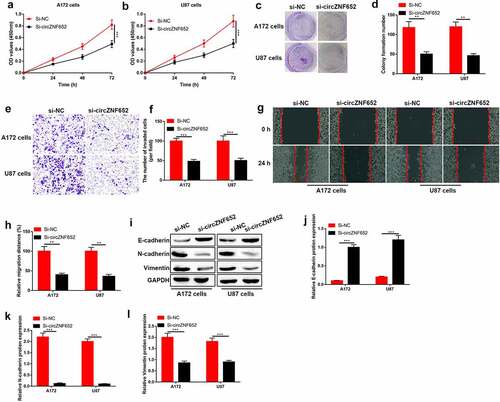
Figure 4. CircZNF652 functioned as a sponger by targeting miR-486-5p in GBM cells. (a) The predicated binding sites between circZNF652 and miR-486-5p were speculated using StarBase. (b) The luciferase activity of circZNF652-wt/mut co-transferred with NC mimic or miR-486-5p mimic into 293 T cells. (c) and (d) The mRNA expression of circZNF652 and miR-486-5p in cell lysates with IgG or Ago2 antibodies was examined using RIP assay. (e) The expression of miR-486-5p in A712 and U87 cells treated with NC inhibitor or miR-486-5p inhibitor. (f) and (g) Cell viability was examined using CCK-8 assay after A172 and U87 cells were transferred with si-NC, si-circZNF652, si-circZNF652+ NC inhibitor, si-circZNF652+ miR-486-5p inhibitor. (h) and (k) The colony formation number was measured using colony formation assay after A172 and U87 cells were transferred with si-NC, si-circZNF652, si-circZNF652+ NC inhibitor, si-circZNF652+ miR-486-5p inhibitor. (i)-(j) and (l)-(m) Cell migration and invasion were determined using wound healing assay and transwell assay after A172 and U87 cells were transferred with si-NC, si-circZNF652, si-circZNF652+ NC inhibitor, si-circZNF652+ miR-486-5p inhibitor. (n)-(q) The protein level of E-cadherin, N-cadherin, vimentin was detected using Western blotting after A172 and U87 cells were transferred with si-NC, si-circZNF652, si-circZNF652+ NC inhibitor, si-circZNF652+ miR-486-5p inhibitor. ***P < 0.001.
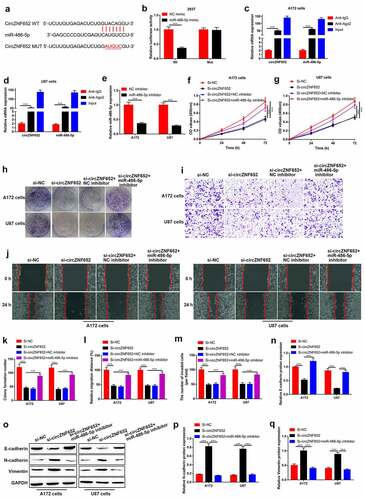
Figure 5. SERPINE1 was targeted by miR-486-5p in GBM cells. (a) The predicated binding sites between SERPINE1 and miR-486-5p were speculated using StarBase. (b) The luciferase activity of SERPINE1-wt/mut co-transferred with NC mimic or miR-486-5p mimic into 293 T cells. (c)-(e) The mRNA and protein levels of SERPINE1 after A172 and U87 cells were transferred with NC mimic or miR-486-5p mimic. ***P < 0.001.
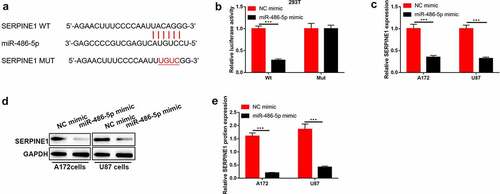
Figure 6. CircZNF652 sponged miR-486-5p to modulate SERPINE1 expression in GBM cells. (a) and (b) The expression of miR-486-5p and SERPINE1 in GBM tissues and adjacent normal tissues. (c) and (d) The overall survival curve of high and low miR-486-5p and SERPINE1 expression GBM patients. (e) Spearman correlation analysis between circZNF652 and miR-486-5p expression, (f) between miR-486-5p and SERPINE1 expression, and (g) between circZNF652 and SERPINE1 expression in GBM tissues. (h)-(j) The mRNA and protein levels of SERPINE1 after A172 and U87 cells were transferred with si-NC or si-circZNF652. (k) and (l) The expression of cirZNF652 was calculated by RT-qPCR after A172 and U87 cells were transferred with NC mimic, miR-486-5p mimic, miR-486-5p mimic+pcDNA3.1, miR-486-5p mimic+pcDNA-SERPINE1. ***P < 0.001.
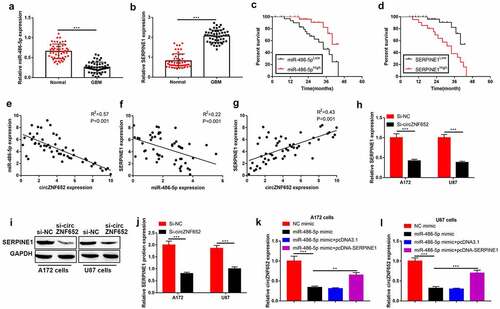
Figure 7. Upregulation of circZNF652 reversed the inhibitory effects of miR-486-5p on GBM cell growth, migration, invasion, and EMT process. (a) and (b) Cell viability was examined using CCK-8 assay after A172 and U87 cells were transferred with NC mimic, miR-486-5p mimic, miR-486-5p mimic+pcDNA3.1, miR-486-5p mimic+pcDNA-SERPINE1. (c) and (d) The colony formation number was measured using colony formation assay after A172 and U87 cells were transferred with NC mimic, miR-486-5p mimic, miR-486-5p mimic+pcDNA3.1, miR-486-5p mimic+pcDNA-SERPINE1. (e)-(h) Cell migration and invasion were determined using wound healing assay and transwell assay after A172 and U87 cells were transferred with NC mimic, miR-486-5p mimic, miR-486-5p mimic+pcDNA3.1, miR-486-5p mimic+pcDNA-SERPINE1. (i)-(l) The protein level of E-cadherin, N-cadherin, vimentin was detected using Western blotting after A172 and U87 cells were transferred with NC mimic, miR-486-5p mimic, miR-486-5p mimic+pcDNA3.1, miR-486-5p mimic+pcDNA-SERPINE1. **P < 0.01, ***P < 0.001.
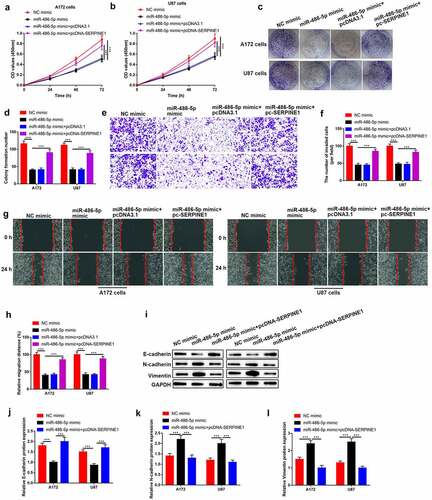
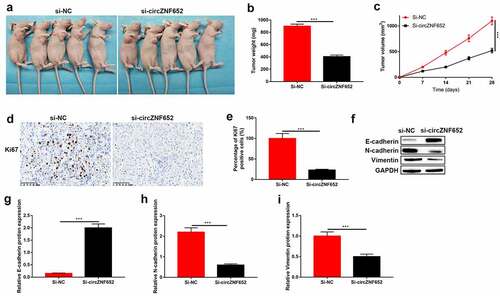
Figure 8. Knockdown of circZNF652 blocked xenograft tumor growth in vivo. (a) The separated xenograft tumors. (b) Tumor weight of the tumors were separated from xenograft mice. (c) Tumor volume of the tumor were separated from xenograft mice. (e) The positive ki67 cells were determined using IHC staining assay. (f)-(i) The protein level of E-cadherin, N-cadherin, vimentin was detected using Western blotting. ***P < 0.001.