Figures & data
Figure 1. The effects of Everolimus on cell viability of gastric epithelial AGS cells. (a). Molecular structure of Everolimus; (b). Cells were stimulated with Everolimus at the concentrations of 0.5 2.5, 5, 25, 50, 250, 500 nM for 24 hours. Cell viability was measured using MTT assay (*, **, P < 0.05, 0.01 vs. vehicle group, N = 6).
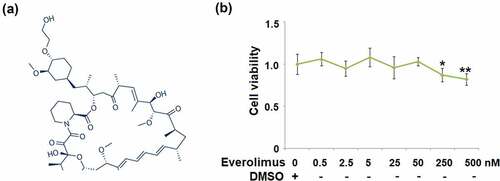
Figure 2. Everolimus ameliorates Helicobacter pylori-induced oxidative stress. Cells were infected with Helicobacter pylori at a bacterium/cell ratio of 500:1, followed by stimulation with Everolimus at the concentrations of 25 and 50 nM for 24 hours. (a). Intracellular levels of ROS; Scale bar, 100 μm; (b). Levels of intracellular MDA were measured (####, P < 0.0001 vs. vehicle group;$, P < 0.01, 0.001 vs. Helicobacter pylori group, N = 5).
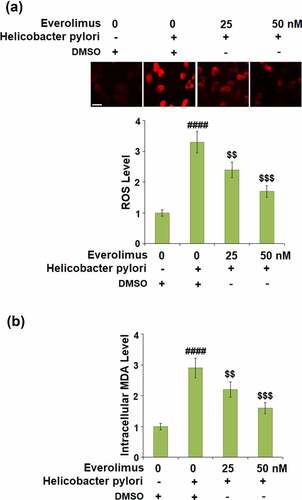
Figure 3. Everolimus inhibits Helicobacter pylori-induced expression and secretions of IL-6, TNF-α, and IL-8. (a-c). mRNA of IL-6, TNF-α, IL-8; (d). Secretions of IL-6; (e). Secretions of TNF-α; (f). Secretions of IL-8 (####, P < 0.0001 vs. vehicle group;$, P < 0.01, 0.001 vs. Helicobacter pylori group, N = 5).

Figure 4. Everolimus suppresses Helicobacter pylori-induced expressions and secretions of CXCL1 and MCP-1. (a-b). mRNA of CXCL1and MCP-1; (c). Secretion of CXCL1; (d). Secretion of MCP-1 (####, P < 0.0001 vs. vehicle group; $, P < 0.01, 0.001 vs. Helicobacter pylori group, N = 5).
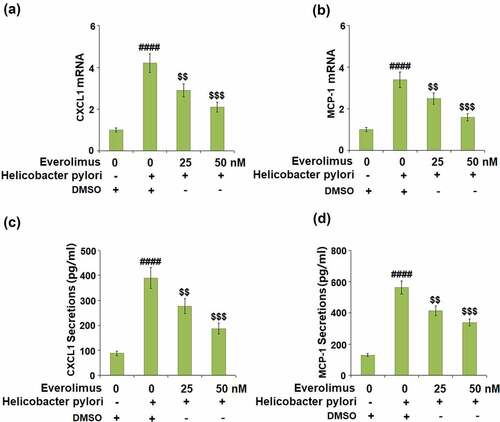
Figure 5. Everolimus suppresses Helicobacter pylori-induced expression of ICAM-1 in gastric epithelial AGS cells. (a). mRNA of ICAM-1; (b). Secretion of ICAM-1 (####, P < 0.0001 vs. vehicle group; $, P < 0.01, 0.001 vs. Helicobacter pylori group, N = 5).
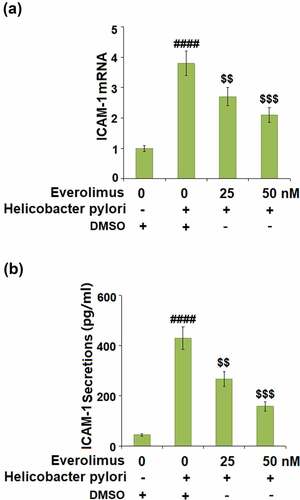
Figure 6. Everolimus but not Rapamycin suppresses Helicobacter pylori-induced attachment of THP-1 cells to gastric epithelial AGS cells. (a). Cells were infected with Helicobacter pylori at a bacterium/cell ratio of 500:1, followed by stimulation with Everolimus at the concentrations of 25 and 50 nM for 24 hours. Attachment of THP-1 cells to gastric epithelial AGS cells was measured using calcein-AM staining. (b). Cells were infected with Helicobacter pylori at a bacterium/cell ratio of 500:1, followed by stimulation with Rapamycin at the concentrations of 25 and 50 nM for 24 hours. Attachment of THP-1 cells to gastric epithelial AGS cells was measured using calcein-AM staining. Scale bar, 100 μm (####, P < 0.0001 vs. vehicle group; $, P < 0.01, 0.001 vs. Helicobacter pylori group, N = 5).
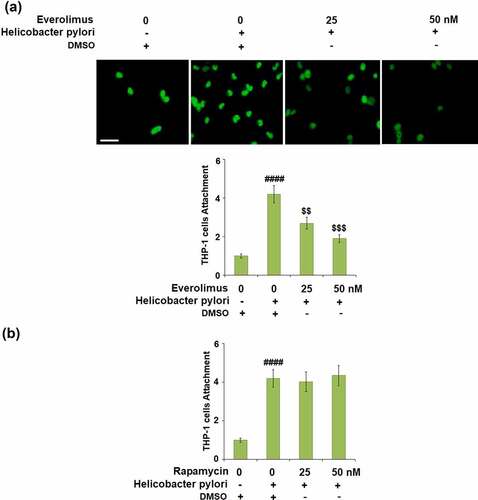
Figure 7. Everolimus suppresses Helicobacter pylori-induced phosphorylation and degradation of IκBα. Cells were infected with Helicobacter pylori, followed by stimulation with Everolimus at the concentrations of 25 and 50 nM for 6 hours. Phosphorylated and total IκBα were measured (####, P < 0.0001 vs. vehicle group;$, P < 0.01, 0.001 vs. Helicobacter pylori group, N = 4).
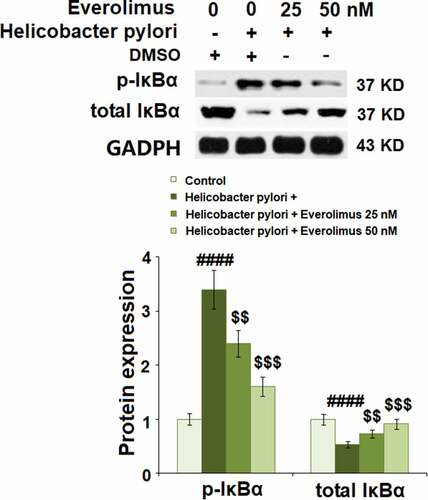
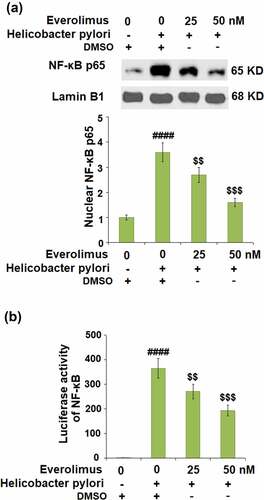
Figure 8. Everolimus suppresses Helicobacter pylori-induced activation of NF-κB. Cells were infected with Helicobacter pylori, followed by stimulation with Everolimus at the concentrations of 25 and 50 nM for 6 hours. (a). Nuclear levels of NF-κB p65; (b). Luciferase activity of NF-κB (####, P < 0.0001 vs. vehicle group;$, P < 0.01, 0.001 vs. Helicobacter pylori group, N = 4).