Figures & data
Table 1. Sequences of primers of qPCR, si-RNA and miRNA
Figure 1. Expression of LINC00525 in colorectal cancer cells.
(A) Results of qPCR indicated that LINC0052 was highly expressed in colorectal cancer cells (SW480, HCT116, HT29, SW620, SW1116 and LoVo) which was compared with normal colonic epithelial cells (NCM-460). Data shown are mean ±SD (n = 3). *** P < 0.001 vs NCM-460 group.(B) LINC00525-specific small interfering RNA (si-525-1, si-525-2 and si-525-3) was transferred into colorectal cancer cells to knock down the expression of LINC00525, and meaningless small interfering RNA (si-NC) was used as a negative control. And qPCR analysis of the indicated LINC00525 levels significantly decreased after being transferred into si-525. Data shown are mean ±SD (n = 3). ### P < 0.001 vs si-NC group.(C) Results of FISH staining not only showed that LINC00525 was expressed in the cytoplasm of colorectal cancer cells, but also confirmed that si-525 significantly knocks down the expression of LINC00525.
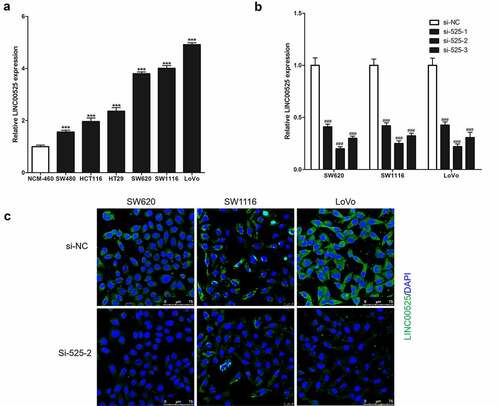
Figure 2. LINC00525 promoted the proliferation of colorectal cancer cells in vitro and in vivo.
(A) Cell viability was detected in SW620, SW1116 and LoVo colorectal cancer cell knocking down LINC00525. Data shown are mean ±SD (n = 3). ** P < 0.01 and *** P < 0.001 vs si-NC group.(B) Representative photographs of cell clone were taken 2 weeks after culture.(C) Comparison of the number of cell clones in SW620, SW1116 and LoVo colorectal cancer cell knocking down LINC00525. Data shown are mean ±SD (n = 3).*** P < 0.001 vs si-NC group.(D) Comparison of the weights of xenografts harvested 3 weeks after injection (n = 7). Data shown are mean ±SD (n = 3). *** P < 0.001 vs si-NC group.
Figure 3. LINC00525 promoted hypoxic glycolysis in colorectal cancer cells.
(A) 24 hours after being cultured under normoxic (21% O2) or hypoxic conditions (1% O2), SW620, SW1116 and LoVo were harvested to detect LINC00525 expression using qPCR. Data shown are mean ±SD (n = 3). *** P < 0.001 vs normoxia group.(B) LoVo cells were cultured under the indicated conditions for 24 hours, and then being harvested to detect LINC00525 expression using qPCR and detect HIF-1α using immunoblotting. Data shown are mean ±SD (n = 3). *** P < 0.001 vs normoxia group (21% O2 group).(C) LoVo cells were cultured under hypoxic conditions (1% O2) for different time, and then being harvested to detect LINC00525 expression using qPCR and detect HIF-1α using immunoblotting. Data shown are mean ±SD (n = 3). *** P < 0.001 vs normoxia group (0 hour group).(D) 24 hours after being cultured under normoxia or hypoxia, we compared lactate levels in the culture medium of SW620, SW1116 and LoVo cells. Data shown are mean ±SD (n = 3). *** P < 0.001 between two groups.(E) 24 hours after being cultured under normoxia or hypoxia, we compared intracellular glucose levels of SW620, SW1116 and LoVo cells. Data shown are mean ±SD (n = 3). *** P < 0.001 between two groups.
Figure 4. Effect of LINC00525 on hypoxic glycolysis is HIF-1α dependent.
(A) 24 hours after being cultured under normoxia or hypoxia, the enzymatic activity of LDHA in SW620, SW1116 and LoVo cells were measured and compared. Data shown are mean ±SD (n = 3). *** P < 0.001 between two groups.(B) 24 hours after being cultured under normoxia or hypoxia, and then analyzed GLUT1 expression using immunofluorescence.(C) LoVo cells expressing either si-NC or si-525 were transfected with or without Flag-HIF-1α, as indicated. 24 hours later, LoVo cells were cultured under normoxia or hypoxia for another 24 hours, and then being harvested to detect HIF-1α expression using immunoblotting.(D) LoVo cells expressing either si-NC or si-525 were transfected with or without Flag-HIF-1α, as indicated. 24 hours later, LoVo cells were cultured under normoxia or hypoxia for another 24 hours, we compared lactate levels in the culture medium of LoVo. Data shown are mean ±SD (n = 3). *** P < 0.001 between two groups.(E) LoVo cells expressing either si-NC or si-525 were transfected with or without Flag-HIF-1α, as indicated. 24 hours later, LoVo cells were cultured under normoxia or hypoxia for another 24 hours, we compared intracellular glucose levels of LoVo. Data shown are mean ±SD (n = 3). *** P < 0.001 between two groups.
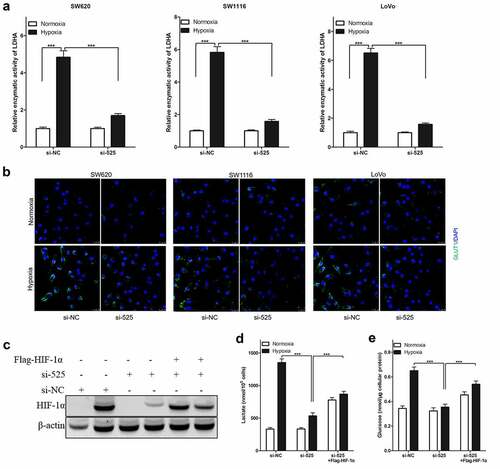
Figure 5. LINC00525 promoted UBE2Q1 expression by sponging to miR-338-3p.
(A) Schematic diagram of binding sites of the 3’UTR of LINC00525 (up) or UBE2Q1 mRNA (down) and miR-338-3p.(B) LoVo cells expressing either si-NC or si-525 were transfected, as indicated. 24 hours later, LoVo cells were cultured under normoxia or hypoxia for another 24 hours, and then being harvested to detect miR-338-3p expression. Data shown are mean ±SD (n = 3). *** P < 0.001 between two groups.(C and D) LoVo cells expressing either miR-338-3p-nc (nc), miR-338-3p-mimic (mimic) or miR-338-3p-inhibitor (inhibitor), as indicated. 24 hours later, LoVo cells were cultured under normoxia or hypoxia for another 24 hours, and then being harvested to detect miR-338-3p (C) or LINC00525 (D) expression. Data shown are mean ±SD (n = 3). *** P < 0.001 between two groups.(E) LoVo cells expressing either miR-338-3p-nc (nc), miR-338-3p-mimic (mimic) or miR-338-3p-inhibitor (inhibitor) were transfected with LINC00525 wild type (WT) or mutant (MUT) transcript, and then detected luciferase activity. Data shown are mean ±SD (n = 3). *** P < 0.001 between two groups.(F) LoVo cells expressing either miR-338-3p-nc (nc), miR-338-3p-mimic (mimic) or miR-338-3p-inhibitor (inhibitor) were transfected with UBE2Q1 wild type (WT) or mutant (MUT) transcript, and then detected luciferase activity. Data shown are mean ±SD (n = 3). *** P < 0.001 between two groups.(G) LoVo cells expressing either si-NC, si-525, miR-338-3p-nc (nc) or miR-338-3p-mimic (mimic), as indicated. 24 hours later, LoVo cells were cultured under normoxia or hypoxia for another 24 hours, and then being harvested to detect UBE2Q1 protein expression. Data shown are mean ±SD (n = 3). *** P < 0.001 between two groups.
Figure 6. Effect of LINC00525 on hypoxic glycolysis is UBE2Q1 dependent.
(A) LoVo cells infecting either AAV-nc or AAV-UBE2Q1 adenovirus, as indicated. 48 hours later, we harvested LoVo cells to detect UBE2Q1 protein expression using immunoblotting (left) and immunofluorescence (right). Data shown are mean ±SD (n = 3). *** P < 0.001 between two groups.(B) LoVo cells expressing either si-NC or si-525 were infected with AAV-nc or AAV-UBE2Q1 adenovirus as indicated. 24 hours later, LoVo cells were cultured under normoxia or hypoxia for another 24 hours, and then being harvested to detect UBE2Q1 protein expression using immunoblotting.(C) LoVo cells expressing either si-NC or si-525 were infected with AAV-nc or AAV-UBE2Q1 adenovirus as indicated. 24 hours later, LoVo cells were cultured under hypoxia for another 24 hours, we compared lactate levels in the culture medium of LoVo. Data shown are mean ±SD (n = 3). *** P < 0.001 between two groups.(D) LoVo cells expressing either si-NC or si-525 were infected with AAV-nc or AAV-UBE2Q1 adenovirus as indicated. 24 hours later, LoVo cells were cultured under hypoxia for another 24 hours, we compared intracellular glucose levels of LoVo. Data shown are mean ±SD (n = 3). *** P < 0.001 between two groups.
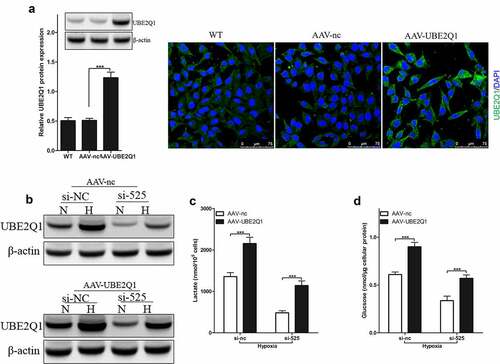
Figure 7. UBE2Q1 stabilized β-catenin, and β-catenin knockdown hypoxia-induced abrogated LINC00525-augmented HIF-1α activation and glycolysis.
(A) LoVo cells infecting either AAV-nc or AAV-UBE2Q1 adenovirus, as indicated. 24 hours later, LoVo cells were cultured under normoxia or hypoxia for another 24 hours, and then being harvested to detect UBE2Q1 protein expression using immunoblotting. Data shown are mean ±SD (n = 3). *** P < 0.001 between two groups.(B) LoVo cells infecting either AAV-nc or AAV-UBE2Q1 adenovirus were treated with cycloheximide (CHX) for increasing time periods, as indicated. and then being harvested to detect β-catenin protein expression using immunoblotting. Data shown are mean ±SD (n = 3). *** P < 0.001 between two groups. Data shown are mean ±SD (n = 3). *** P < 0.001 between two groups.(C) The lysates of LoVo stably overexpressing AAV-nc or AAV-UBE2Q1 adenovirus were immunoprecipitated (IP) with β-Catenin antibody. The IP products were further analyzed by immunoblotting to detect ubiquitin expression. The expression of β-Catenin and UBE2Q1 in the input fraction is presented below.(D) LoVo cells expressing either si-NC or si-525 were infected with AAV-nc or AAV-UBE2Q1 adenovirus as indicated. 24 hours later, LoVo cells were cultured under hypoxia for another 24 hours, and then being harvested to detect UBE2Q1, β-Catenin and HIF-1α protein expression using immunoblotting.(E) Comparison of HIF-1α protein expression in LoVo cells which was treated as showed in (D). Data shown are mean ±SD (n = 3). *** P < 0.001 between two groups.(F) LoVo cells expressing either si-NC or si-525 were infected with AAV-nc or AAV-UBE2Q1 adenovirus as indicated. 24 hours later, LoVo cells were cultured under hypoxia for another 24 hours, we compared lactate levels in the culture medium of LoVo. Data shown are mean ±SD (n = 3). *** P < 0.001 between two groups.(G) LoVo cells expressing either si-NC or si-525 were infected with AAV-nc or AAV-UBE2Q1 adenovirus as indicated. 24 hours later, LoVo cells were cultured under hypoxia for another 24 hours, we compared intracellular glucose levels of LoVo. Data shown are mean ±SD (n = 3). *** P < 0.001 between two groups.