Figures & data
Table 1. Number of DE mRNA, tRF/tiRNA and miRNA in PAITA
Figure 1. The heatmap of DE microRNA, tRF/tiRNA and mRNA.
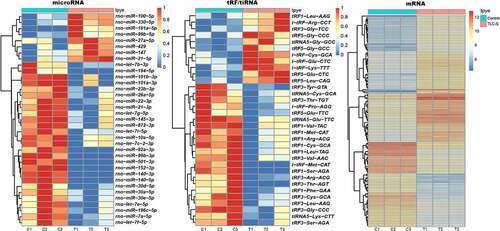
Figure 2. The microRNA-mRNA regulatory network in PAITA. Triangle represents microRNA. Circle represents mRNA. Circle with gray edge represents transcription factor. Color represents the p value of DE genes. Node size represents network degree of DE gene.
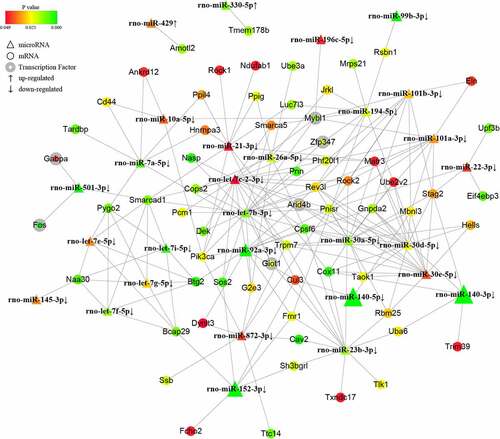
Figure 3. The tRF/tiRNA-mRNA regulatory network in PAITA. Triangle represents tRF/tiRNA. Circle represents mRNA. Circle with gray edge represents transcription factor. Color represents the p value of DE genes. Node size represents network degree of DE gene.
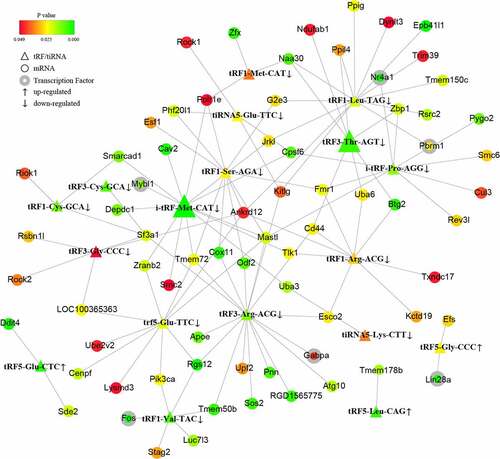
Figure 4. GO and KEGG pathway analysis of the microRNA-mRNA regulatory network in PAITA.
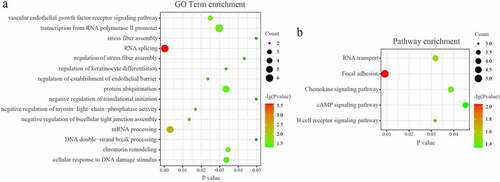
Figure 5. GO and KEGG pathway analysis of the tRF/tiRNA-mRNA regulatory network in PAITA.
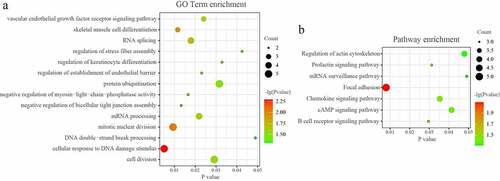
Figure 6. Combined microRNA and tRF/tiRNA regulatory network in PAITA.
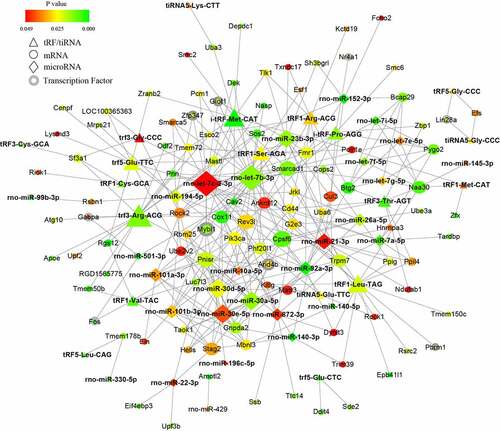
Figure 7. The distribution of six tRF/tiRNA types in PAITA. a, Overall distribution of six tRF/tiRNA types. b, Distribution of six tRF/tiRNA types in each tRNA.
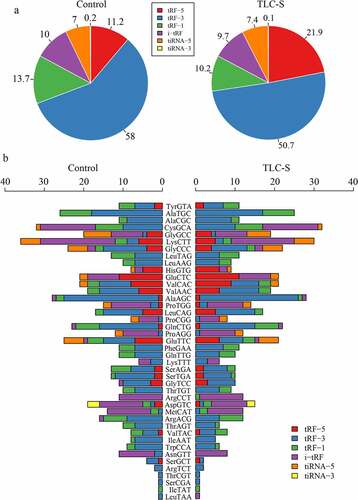
Figure 8. The expression of tRF3-Thr-AGT in PAITA and RNA intervention. a, The fold change of tRF3-Thr-AGT in PAITA. b, The sequence and location of tRF3-Thr-AGT in tRNA. c, Verification of tRF3-Thr-AGT source. d, The expression of tRF3-Thr-AGT in each group after RNA intervention. ***P < 0.001.
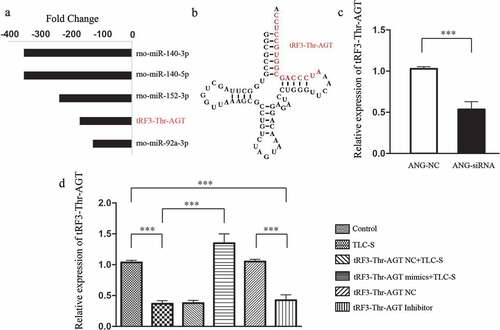
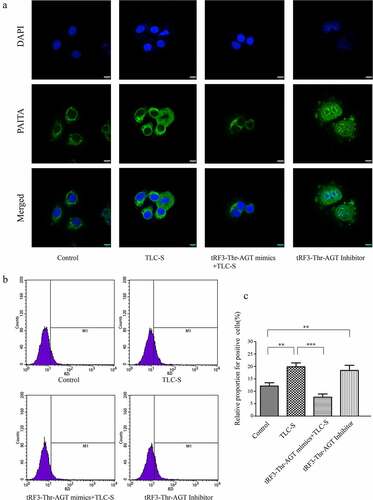
Figure 9. Trypsinogen activation in each group after RNA intervention. a, Image fromlaser confocal microscopy. b, Histogram of flow cytometry. c, Chart of statistics. **P < 0.01. ***P < 0.001.