Figures & data
Figure 1. Downregulated TMEM100 expression is associated with poor prognosis in PCa. a, Data in GEPIA database showed downregulation of TMEM100 in PCa. b, Data in GEPIA database showed the relationship of TMEM100 expression and over survival of PCa patients. mRNA (c) and protein level (d) of TMEM100 in normal prostatic epithelial cells and several PCa cells were detected. Data are expressed as mean ± SD. *P < 0.05, ***P < 0.001 versus control.
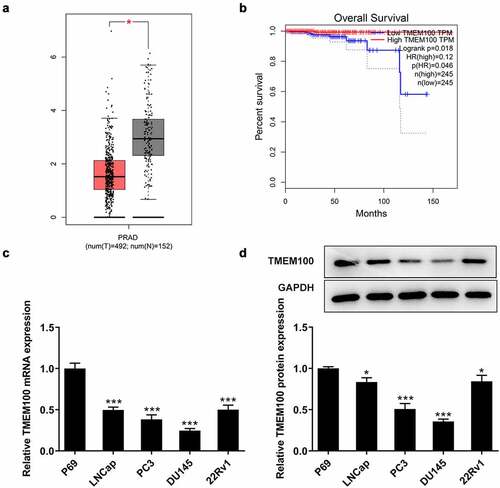
Figure 2. Effects of TMEM100 overexpression on the proliferation of DU145 cells. mRNA (a) and protein level (b) of TMEM100 were measured after TMEM100 was overexpressed. Cell proliferation was identified by CCK-8 assay (c) and colony formation assay (d). Data are expressed as mean ± SD. *P < 0.05, ***P < 0.001 versus NC group.
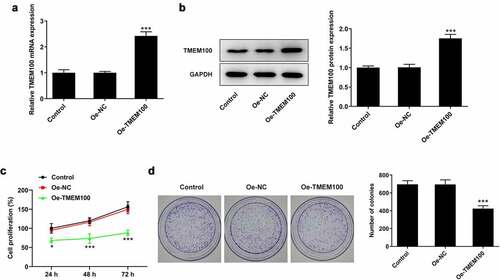
Figure 3. Effects of TMEM100 overexpression on migration, invasion and EMT of DU145 cells. A, Wound healing assay was performed to assess cell migration. B, Transwell assay was used to detect cell invasion. C, Protein levels of MMP2 and MMP9 were measured by Western blot assay. D, EMT-related proteins was identified by detection of E-cadherin, N-cadherin, Vimentin and Snail. Data are expressed as mean ± SD. *P < 0.05, **P < 0.01, ***P < 0.001 versus NC group.
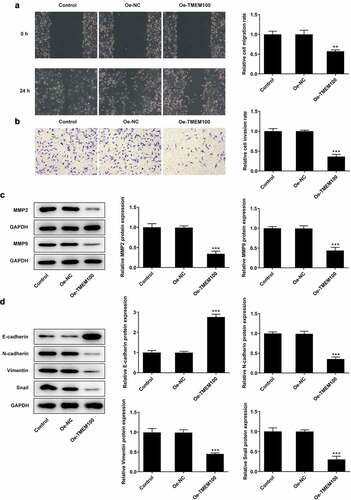
Figure 4. GATA5 expression is downregulated in PCa tissues and cells. A, Data in GEPIA database showed downregulation of GATA5 in PCa. mRNA (b) and protein levels (c) of GATA5 in normal prostatic epithelial cells and DU145 cells were detected. Data are expressed as mean ± SD. *P < 0.05, ***P < 0.001 versus control.
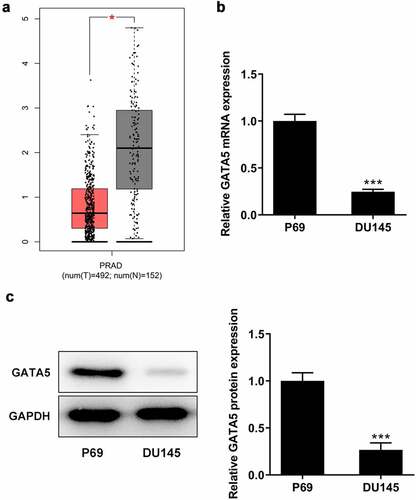
Figure 5. GATA5 binds to the TMEM100 promoter and regulates TMEM100 expression. a, The binding site of GATA5 and TMEM100. mRNA (b) and protein level (c) of GATA5 were measured after GATA5 was overexpressed or silenced. mRNA (d) and protein level (e) of TMEM100 were detected after GATA5 was overexpressed or silenced. ***P < 0.001 versus sh-NC. F, TMEM100 promoter activity was evaluated by luciferase reporter assay. G, Chromatin immunoprecipitation assay was carried out tom detect the binding level of GATA5 and TMEM100 promotor. Data are expressed as mean ± SD. ***P < 0.001 versus control. ###P < 0.001 versus Oe-NC.
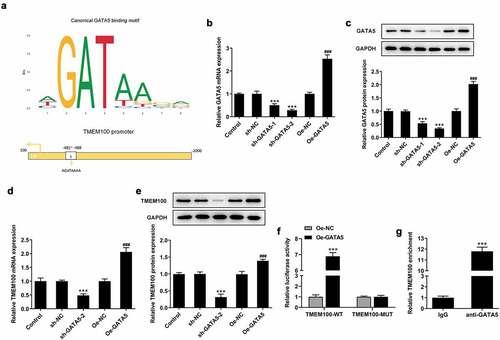
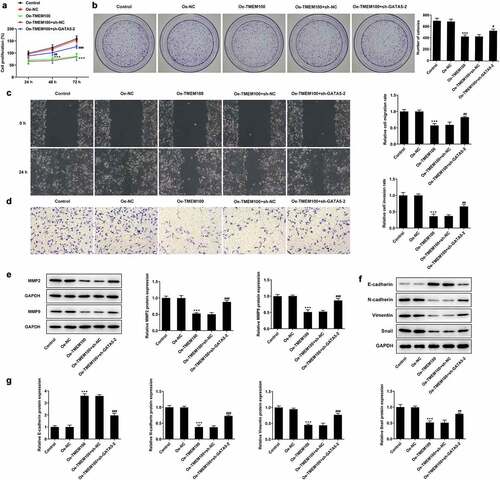
Figure 6. Effects of GATA5 silencing on TMEM100-mediated migration, invasion and EMT of DU145 cells. Cell proliferation was identified by CCK-8 assay (a) and colony formation assay (b). C, Wound healing assay was implemented to assess cell migration. D, Transwell assay was employed to detect cell invasion. E, Protein levels of MMP2 and MMP9 were investigated by Western blot assay. F and G, EMT-related proteins was determined with detection of E-cadherin, N-cadherin, Vimentin and Snail. Data are expressed as mean ± SD. ***P < 0.001 versus Oe-NC. #P < 0.05, ##P < 0.01, ###P < 0.001 versus Oe-TMEM100+ sh-NC.