Figures & data
Figure 1. Differential analysis of intestinal flora between HIV patients and healthy individuals. A Alpha diversity analysis of OTU number and microbial colony diversity in both groups. Observed species indices (the actual number of OTU on observation), Chao1 index (estimated total number of OTU contained in the samples), ACE index (estimated total number of OTU contained in the samples), Shannon index (estimated microbial colony diversity), Simpson index (estimated microbial colony diversity). B, Cluster analysis of flora. C, Statistical results of bacterial abundance in the HIV group. D, Statistical results of bacterial abundance in the healthy group.
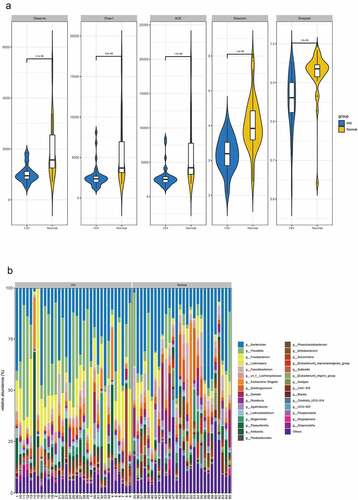
Figure 1. Continued.
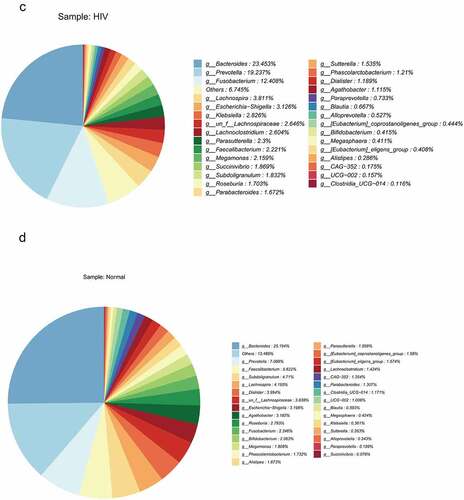
Figure 2. The species difference and association analysis between HIV and healthy groups. The LEfSe analysis was used to estimate the abundance influence of each strain on the difference. A, LEfSe analysis clustering tree. Red represented the HIV group, green represented the healthy group, and nodes of different colors represented the importance of microbiome in the representative group. The yellow nodes indicated the microbiota that did not play an important role in both groups. B, LDA analysis results.
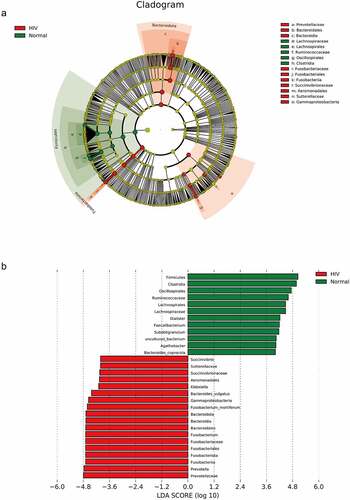
Figure 3. Correlation analysis between different strains and IL-2, IL-8, and TNF-α. Spearman correlation analysis on the different strains and the contents of IL-2, IL-8, and TNF-α between the HIV and healthy groups. Red represented positive correlation and blue represented negative correlation. Asterisk represented a significant difference (p < 0.05).
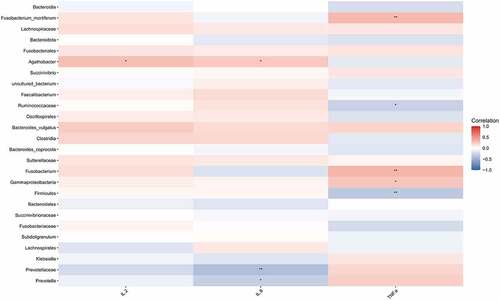
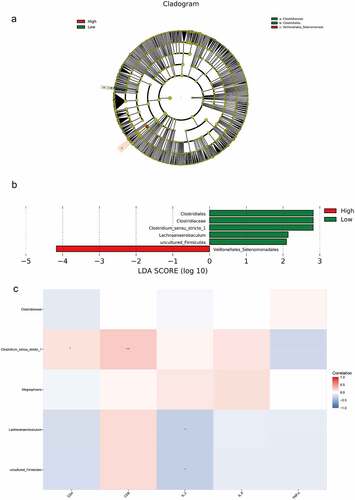
Figure 4. The impact of the difference in CD4 T cell count on the intestinal flora of HIV patients. The HIV patients were divided into a high CD4 group (≥ 350/mm3) and low CD4 group (< 350/mm3) according to CD4 T cell count, and subsequently compared with the healthy group to identify the differences in flora between the three groups. A, Alpha diversity analysis. B, Clustering analysis. C, Bacteria abundance in the high CD4 group. D, Bacteria abundance in the low CD4 group).
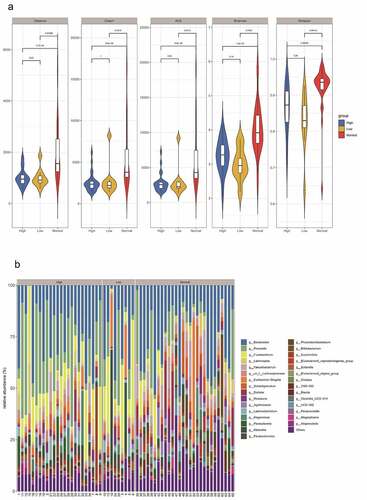
Figure 4. Continued.
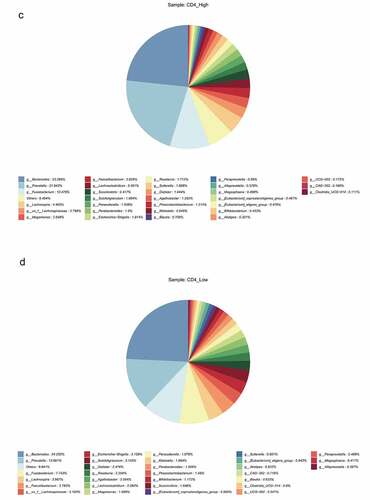
Figure 5. LEfSe analysis and Spearman correlation analysis compared bacteria differences and correlation analysis between the high and low CD4 groups. A, LEfSe analysis of the clustering tree, red represented the high CD4 group, green represented the low CD4 group, and nodes of different colors represented the importance of microbiome in the representative group. The yellow nodes indicated the microbiota that did not play an important role in both groups. B, LDA analysis results. C, Spearman was adopted to analyze the correlation between the differential flora and CD4, CD8, IL-2, IL-8 and TNF-α.