Figures & data
Table 1. The primer lists
Figure 1. Flow chart of the present study. PR, pyroptosis-related; DEGs, differentially expressed genes; ROC, receiver operating characteristic curve; DCA, decision curve analysis.
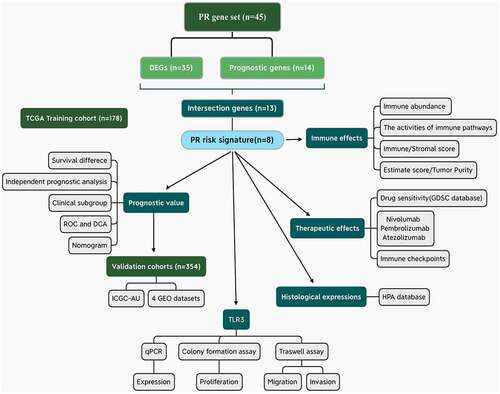
Figure 2. Construction of pyroptosis-related risk signature. (a) The heat map of pyroptosis DEGs. The absolute value of Log2FC is greater than or equal to 0.58. (b) Prognosis-related pyroptosis genes. (c) Venn plot exhibits the intersection between pyroptosis DEGs and prognostic PRGs. (d, e) The analytical process of lasso regression analysis. (f) The coefficients of each PRG in PR risk signature. (g) The risk plots of PR risk signature. (h) The relationships between PR risk score and PAAD clinicopathological features. (i) The survival difference between high- and low-PR risk group. (j) PCA results in TCGA cohort. PR, pyroptosis-related; DEGs, differentially expressed genes; PRGs, pyroptosis-related genes; PAAD, pancreatic adenocarcinoma; PCA, Principal component analysis.
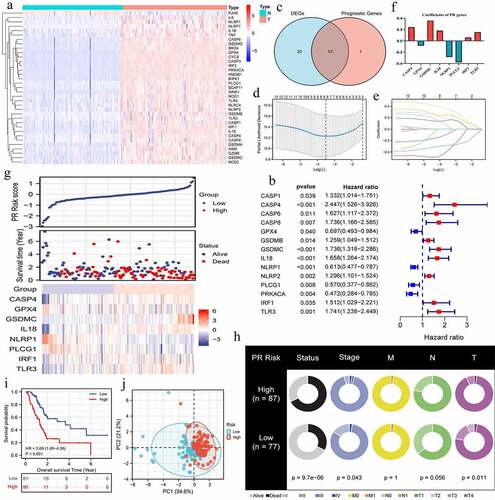
Figure 3. The prognostic value of pyroptosis-related risk signature. (a) ROC curves of multiple different indexes for predicting patients’ survival outcomes. (b) Time-dependent ROC curves of PR model. (c) The univariate independent prognostic analysis. (d) The multivariate independent prognostic analysis. (e-n) Clinical subgroup prognostic analyses. (o) DCA results. ‘Model A’ represents the traditional prognostic model consisting of age, histological grade, and clinical stage. ‘Model B’ represents the traditional prognostic model consisting of age, histological grade, and TNM staging. ‘Improved A and B’ represent the improved model A and B with PR risk score added, respectively. (p) The nomogram predicting 1-, 3-, 5-year overall survival probability of PAAD patients. (o-s) Calibration curves of the nomogram. PR, pyroptosis-related; ROC, receiver operating characteristic curve; DCA, decision curve analysis; PAAD, pancreatic adenocarcinoma.
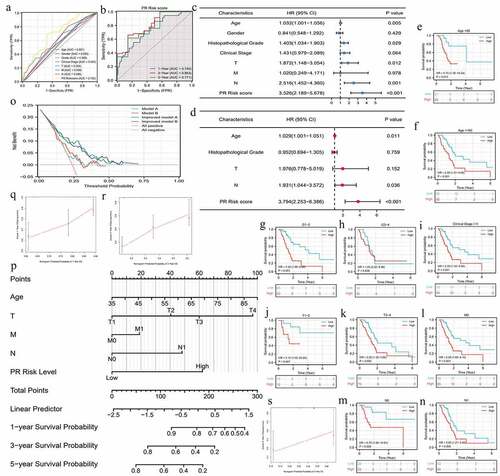
Figure 4. The pyroptosis-related risk signature is also applicable in validation cohorts. (a, b) The survival difference and ROC analyses in ICGC-AU cohort. (c, d) The survival difference and ROC analyses in GSE62452 cohort. (e, f) The survival difference and ROC analyses in GSE21501 cohort. (g, h) The survival difference and ROC analyses in GES28735 cohort. (i, j) The survival difference and ROC analyses in GSE57495 cohort. (k) The survival meta-analysis of five validation cohorts. PR, pyroptosis-related; ROC, receiver operating characteristic curve.
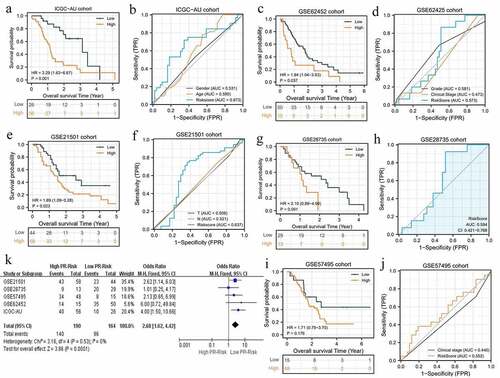
Table 2. The effects of high PR risk score on TIM
Figure 5. The effects of pyroptosis-related risk score on tumor immune microenvironment. (a) The differences in infiltrating levels of 22 lymphocyte subtypes between high- and low-PR risk groups. (b) The differences in immune scores between different PR risk groups. (c) The differences in tumor purity between different PR risk groups. (d) The differences in activities of 13 immune-related pathways between different PR risk groups. (e) The immune heat map depicts different immune landscapes of high- and low-PR risk levels. PR, pyroptosis-related; *p < 0.05, **p < 0.01, ***p < 0.001.
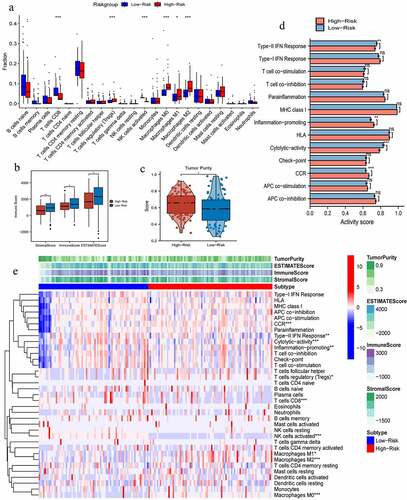
Figure 6. The genomic information of 8 risk pyroptosis-related genes. (a) Somatic mutation frequency of 8 PRGs in four gastrointestinal cancers. (b) The heterozygous CNV frequency of 8 PRGs. (c) The homozygous CNV frequency of 8 PRGs. (d) The correlations between CNV frequency and mRNA expression. (e) Waterfall plot shows the somatic mutations of 8 PRGs in 125 gastrointestinal cancer samples. (f) The methylation difference between gastrointestinal tumor and normal samples. (g) The correlations between genetic methylation and mRNA expression. PRGs, pyroptosis-related genes; CNV, Copy number variation; COAD, colon adenocarcinoma; STAD, stomach adenocarcinoma; LIHC, liver hepatocellular carcinoma; PAAD, pancreatic adenocarcinoma.
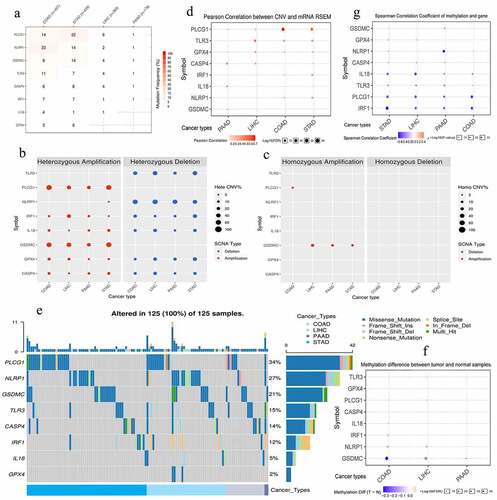
Table 3. The clinical information of four ICIs-related datasets
Figure 7. The effects of pyroptosis-related risk score on the efficacy of PD-1/L1 inhibitors. (a) The expressive differences of 6 ICs between high- and low-PR risk groups. (b-g) The expressive correlations between PR risk score and 6 ICs. (h-k) The differences in PR risk score between response- and non-response patients for PD-1/L1 inhibitors treatments. (m) The relationships between the expressions of 8 risk PRGs and the sensitivities (IC50) of multiple drugs. PR, pyroptosis-related; PRGs, pyroptosis-related genes; ICs, immune checkpoints; IC50, half maximal inhibitory concentration; ns, not significantly; *p < 0.05, **p < 0.01.
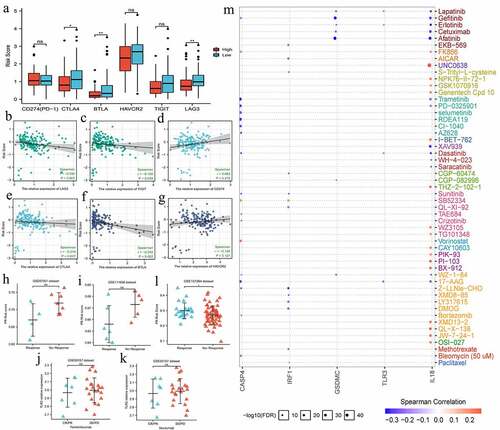
Figure 8. The histological expressions of 8 risk pyroptosis-related genes. The top of the figure indicates the category of tissue specimen. The name of pyroptosis regulator, the antibody type, the patient ID, and the staining intensity are listed at the bottom of each image.
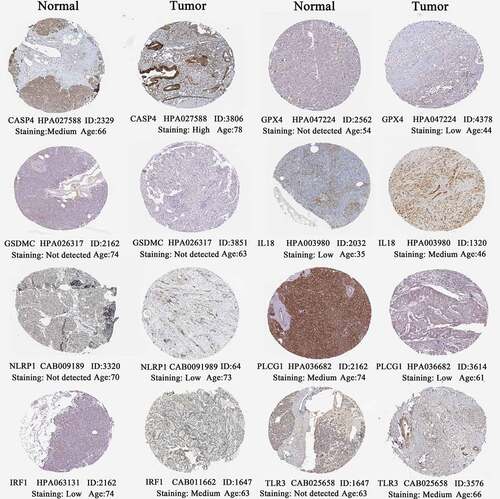
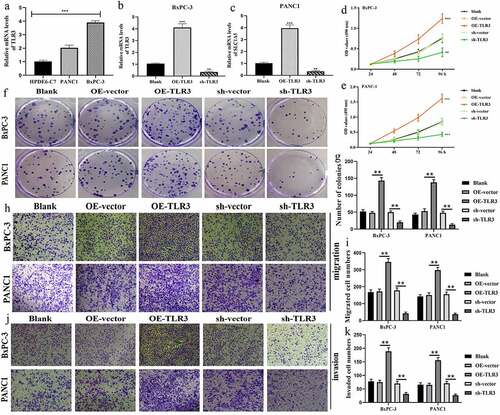
Figure 9. TLR3 has cancer-promoting abilities in pancreatic cancer cells. (a) The expressive differences of TL3 between normal pancreatic duct epithelia and PC cells. (b, c) Transfection efficiency in BxPC-3 and PANC1 cells. (d, e) MTT assays revealed that TLR3 promoted PC cells proliferation. (f, g) Colony formation assays revealed that TLR3 promoted PC cells proliferation. (h, i) Evaluations of the TLR3 effects on PC cells migration through transwell assays. (j, k) Evaluations of the TLR3 effects on PC cells invasion through transwell assays. PC, pancreatic cancer; *p < 0.05, **p < 0.01, ***p < 0.001.