Figures & data
Figure 1. MiR-128-3p expression was reduced and ZEB1 was enhanced in OA tissues and IL-1β-activated chondrocytes. (a and b) RT-qPCR assay was applied to detect the expression of miR-128-3p and ZEB1 in OA cartilage tissues (n = 32) and normal cartilage tissues (n = 32). (c) Pearson′s correlation analysis showed the correlation between miR-128-3p and ZEB1 in OA cartilage tissues (n = 32). (d) RT-qPCR assay showed the expression of miR-128-3p in IL-1β-induced CHON-001 cells. (e) RT-qPCR assay showed ZEB1 expression in IL-1β-induced CHON-001 cells. Data are expressed as the mean± SD (n = 3) *P < 0.05.
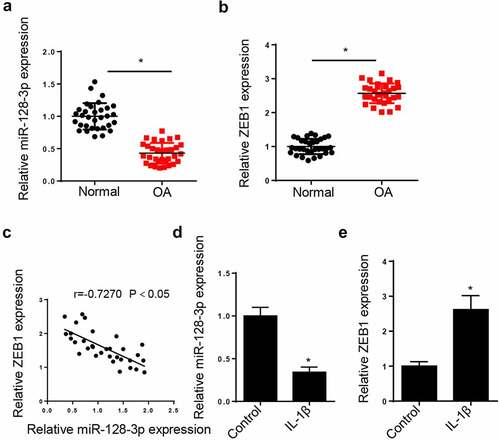
Figure 2. MiR-128-3p inhibited the apoptosis and facilitated the proliferation of CHON-001 cells treated with IL-1β. (a) RT-qPCR analysis showed miR-128-3p expression in CHON-001 cells transfected with NC mimics or miR-128-3p mimics. (b) RT-qPCR analysis showed miR-128-3p expression in CHON-001 cells treated with IL-1β, IL-1β+NC mimics or IL-1β+miR-128-3p mimics. (c) Western blot assay measured the levels of MMP-13, collagen II and aggrecan in CHON-001 cells treated with IL-1β, IL-1β+NC mimics or IL-1β+miR-128-3p mimics. (d) CCK-8 was used to test the proliferation in CHON-001 cells transfected with IL-1β, IL-1β+NC mimics or IL-1β+miR-128-3p mimics. (e) TUNEL assay showed the apoptosis in CHON-001 cells transfected with IL-1β, IL-1β+NC mimics or IL-1β+miR-128-3p mimics. Data are expressed as the mean± SD (n = 3). *P < 0.05.
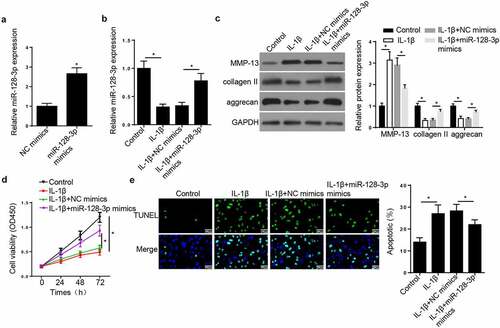
Figure 3. ZEB1 depletion ameliorated the effects of IL-1β treatment on OA progression in chondrocytes. (a) RT-qPCR assay showed ZEB1 expression in CHON-001 cells transfected with shNC or shZEB1. (b) RT-qPCR assay showed ZEB1 expression in CHON-001 cells treated with IL-1β, IL-1β+shNC or IL-1β+shZEB1. (c) Western blot assay measured the levels of MMP-13, collagen II and aggrecan in CHON-001 cells treated with IL-1β, IL-1β+shNC or IL-1β+shZEB1. (d) CCK-8 was used to test the proliferation in CHON-001 cells treated with IL-1β, IL-1β+shNC or IL-1β+shZEB1. (e) TUNEL assay showed the apoptosis in CHON-001 cells treated with IL-1β, IL-1β+shNC or IL-1β+shZEB1. Data are expressed as the mean± SD (n = 3). *P < 0.05.
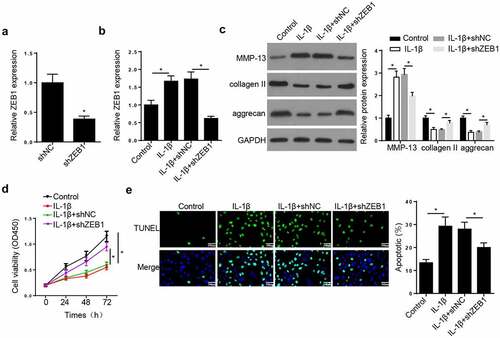
Figure 4. ZEB1 was directly targeted by miR-128-3p. (a) Binding sequences between miR-128-3p and ZEB1 were predicted by starBase website. (b) Luciferase reporter assay was adopted to verify the binding ability between miR-128-3p and ZEB1 in CHON-001 cells. (c) RIP assay was used to analyze the enrichment of miR-128-3p and ZEB1 in CHON-001 cells of anti-Ago2 group compared with anti-IgG group. (d) RT-qPCR analysis showed miR-128-3p expression in CHON-001 cells transfected with miR-128-3p inhibitor. (e and f) RT-qPCR and Western blot analysis was applied to detect ZEB1 expression in CHON-001 cells transfected with miR-128-3p mimics and miR-128-3p inhibitor. (g) RT-qPCR analysis showed ZEB1 expression in CHON-001 cells treated with IL-1β, IL-1β+NC mimics or IL-1β+miR-128-3p mimics. Data are expressed as the mean± SD (n = 3). *P < 0.05.
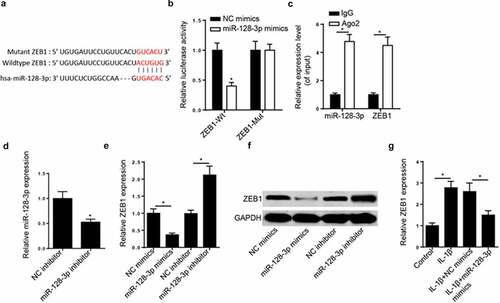
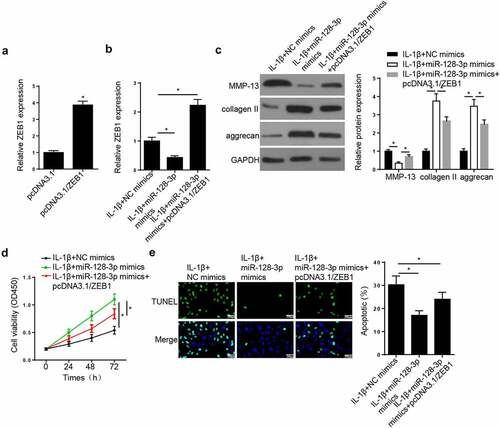
Figure 5. ZEB1 addition reversed the effects of miR-128-3p overexpression on OA progression in IL-1β-treated chondrocytes. (a) RT-qPCR assay showed ZEB1 expression was upregulated in CHON-001 cells transfected with pcDNA3.1/ZEB1. (b) RT-qPCR assay showed ZEB1 expression in CHON-001 cells treated with IL-1β+miR-128-3p mimics, IL-1β+miR-128-3p mimics+pcDNA3.1/ZEB1. (c) Western blot assay measured the levels of MMP-13, collagen II and aggrecan in CHON-001 cells treated with IL-1β+miR-128-3p mimics, IL-1β+miR-128-3p mimics+pcDNA3.1/ZEB1. (d and e) CCK-8 and TUNEL assays were used to test the proliferation and apoptosis in CHON-001 cells treated with IL-1β+miR-128-3p mimics, IL-1β+miR-128-3p mimics+pcDNA3.1/ZEB1. Data are expressed as the mean± SD (n = 3). *P < 0.05.