Figures & data
Table 1. PCR primers used in this study
Figure 1. PAX6 and miR-511-3p can be potentially critical downstream effectors of ZFPM2-AS1 in retinoblastoma. (a) The intersection between the top 100 significantly upregulated genes in retinoblastoma according to GSE97508 profiling (adjusted P < 0.05) and the predicted targets of miR-511-3p by targetscan algorithm. (b) The protein-protein interaction network of the 26 common genes from figure (a) The number of lines between every two nodes represents the associations.
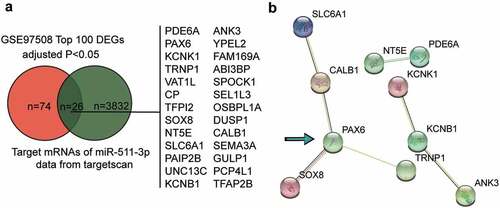
Figure 2. Inhibition of ZFPM2-AS1 decreases retinoblastoma malignancy. (a) Expression of ZFPM2-AS1 in tumor and normal samples. **P < 0.001. (b) Expression of ZFPM2-AS1 in human retinal epithelial cells (ARPE-19) and human retinoblastoma cells (SO-RB50, Y79, WERI-Rb1 and HXO-Rb44). *P < 0.05, **P < 0.001 compared with ARPE-19. (c) ZFPM2-AS1 mostly expressed in cytoplasm. U6 as control in nucleus. GAPDH as control in cytosol. (d) The transfection efficiency of different siRNAs targeting ZFPM2-AS1. (e) Cell viability decreased by inhibition of si-ZFPM2-AS1. (f) Apoptotic marker caspase-3 increased when treated with si-ZFPM2-AS1. (g) Inhibition of ZFPM2-AS1 decreased cell migration capability. (d-g) **P < 0.001 compared with si-NC.
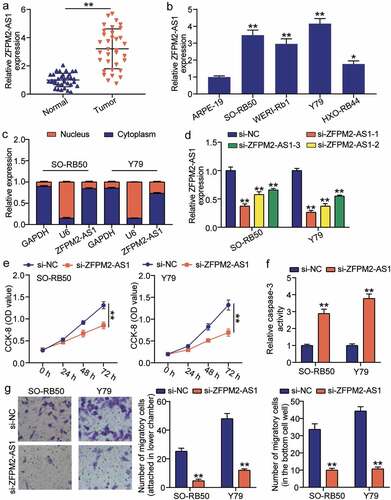
Figure 3. ZFPM2-AS1 targets to miR-511-3p in retinoblastoma. (a) Expression of miR-511-3p in tumor and normal samples. **P < 0.001. (b) The relation of expression between ZFPM2-AS1 and miR-511-3p in tumor samples was analyzed by Pearson analysis. (c) Expression of miR-511-3p in human retinal epithelial cells (ARPE-19) and human retinoblastoma cells (SO-RB50, Y79, WERI-Rb1 and HXO-Rb44). **P < 0.001 compared with ARPE-19. (d) Target sequences between ZFPM2-AS1 and miR-511-3p. (e) Luciferase assay proved the target relationship between ZFPM2-AS1 and miR-511-3p in SO-RB50 and Y79 cells. **P < 0.001 compared with mimic-NC. (f) si-ZFPM2-AS1 upregulated miR-511-3p expression in SO-RB50 and Y79 cells. **P < 0.001 compared with si-NC. (g) The effect of miR-511-3p mimic, miR-511-3p inhibitor, si-ZFPM2-AS1 on miR-511-3p expression in SO-RB50 and Y79 cells. mimic, miR-511-3p mimic. inhibitor, miR-511-3p inhibitor. **P < 0.001 compared with mimic-NC. ##P < 0.001 compared with inhibitor-NC. &&P < 0.001 compared with inhibitor+si-ZFPM2-AS1.
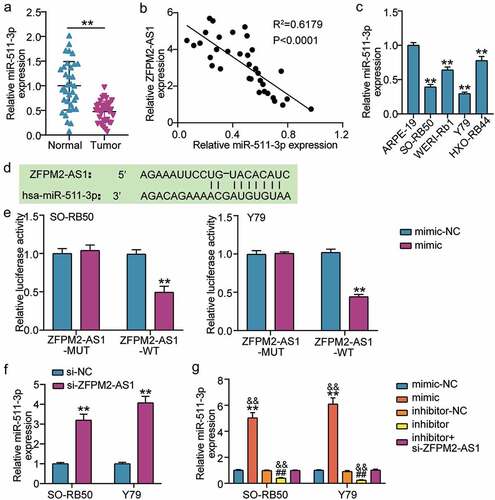
Figure 4. ZFPM2-AS1 relieved the effect of miR-511-3p on retinoblastoma cells. (a) ZFPM2-AS1 relived the effect of miR-511-3p on cell viability. (b) ZFPM2-AS1 relived the effect of miR-511-3p on caspase-3 activity. (c) ZFPM2-AS1 relived the effect of miR-511-3p on cell migration. mimic, miR-511-3p mimic. inhibitor, miR-511-3p inhibitor. **P < 0.001 compared with mimic-NC. ##P < 0.001 compared with inhibitor-NC. &&P < 0.001 compared with inhibitor-NC.
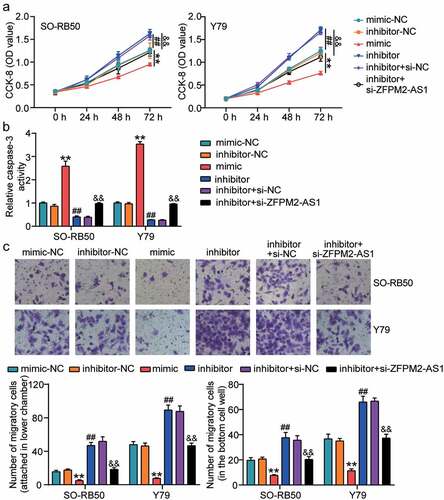
Figure 5. miR-511-3p and PAX6 locate in the downstream of ZFPM2-AS1. (a) Target sequences between PAX6 and miR-511-3p. (b) Luciferase assay proved the target relationship between PAX6 and miR-511-3p in SO-RB50 and Y79 cells. **P < 0.001 compared with mimic-NC. (c) Expression of PAX6 in tumor and normal samples. **P < 0.001. (d) The correlation of expression between PAX6 and miR-511-3p in tumor samples was analyzed by Pearson analysis. E-F. si-ZFPM2-AS1 upregulated the expression of PAX6 mRNA (e) and protein (f) in SO-RB50 and Y79 cells. **P < 0.001 compared with si-NC. G-H. The effects of miR-511-3p mimic, miR-511-3p inhibitor, si-ZFPM2-AS1 on the expression of PAX6 mRNA (g) and protein (h) in SO-RB50 and Y79 cells. mimic, miR-511-3p mimic. inhibitor, miR-511-3p inhibitor. **P < 0.001 compared with mimic-NC. ##P < 0.001 compared with inhibitor-NC. &&P < 0.001 compared with inhibitor-NC.
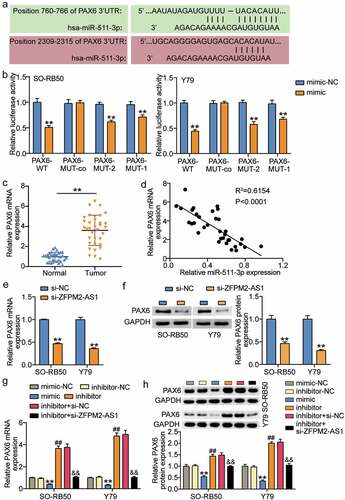
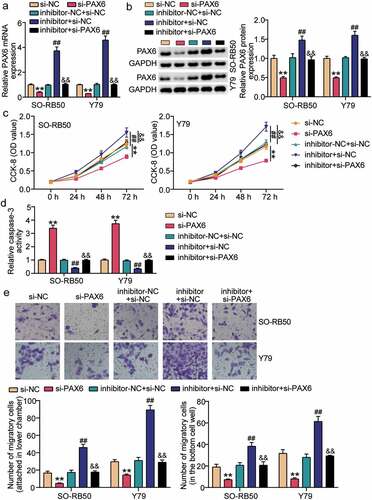
Figure 6. miR-511-3p relived the effect of PAX6 on retinoblastoma cells. (a–b). The effects of miR-511-3p inhibitor and si-PAX6 on the expression of PAX6 mRNA (a) and protein (b) in SO-RB50 and Y79 cells. (c) miR-511-3p relived the effect of PAX6 on cell viability. (d) miR-511-3p relived the effect of PAX6 on caspase-3 activity. (e) miR-511-3p relived the effect of PAX6 on cell migration. inhibitor, miR-511-3p inhibitor. **P < 0.001 compared with si-NC. ##P < 0.001 compared with inhibitor-NC+si-NC. &&P < 0.001 compared with inhibitor+si-NC.