Figures & data
Table 1. Patient details
Table 2. Bilirubin changes before and after treatment
Table 3. Changes in tumor size (mm2) between the two groups
Figure 1. Comparison of biliary patency time after treatment between the two groups of patients.
a: p < 0.05 vs. Group A.
Table 4. The expression of tumor markers in stage I-stage patients before treatment
Table 5. Comparison of tumor marker expression after treatment between the two groups
Table 6. Comparison of p53 expression after treatment between the two groups
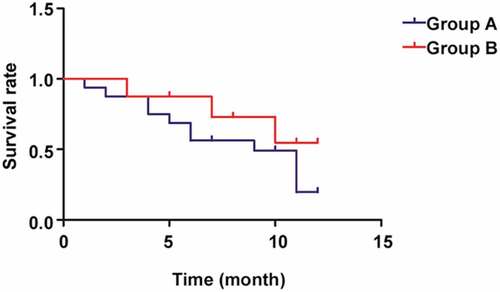
Figure 2. Patient survival in the two groups.