Figures & data

Table 1. Primers sequences used for qRT-PCR
Table 2. Correlation between the clinicopathologic variables and hsa_circ_0001955 expression in HCC patients (n = 35)
Figure 1. Circ_0001955 expression is up-regulated in HCC. (a) Volcano plot of the differential circRNA expression analysis. (b) CircRNA expression profiles. (c, d) qRT-PCR analysis of circ_0001955 expression level in HCC tissues and normal tissues (n = 5). (e) qRT-PCR analysis of circ_0001955 expression level in HCC tissues from stage I–II (n = 12) and stage III (n =23). (f) qRT-PCR analysis of circ_0001955 expression level in HCC cells and normal THLE-2 cells. *P < 0.05.
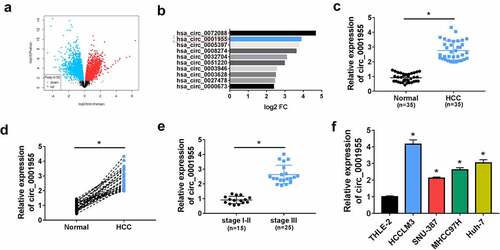
Figure 2. Characterization of molecular structure of circ_0001955. (a) The exonic information of circ_0001955 was illustrated as indicated. (b, c) qRT-PCR analysis of circ_0001955 and linear CSNK1G1 mRNA expression in HCCLM3 and Huh-7 cells treated with RNase R or mock. (d, e) Analysis of the cellular distribution of circ_0001955 by cellular RNA fractionation assay. *P < 0.05.
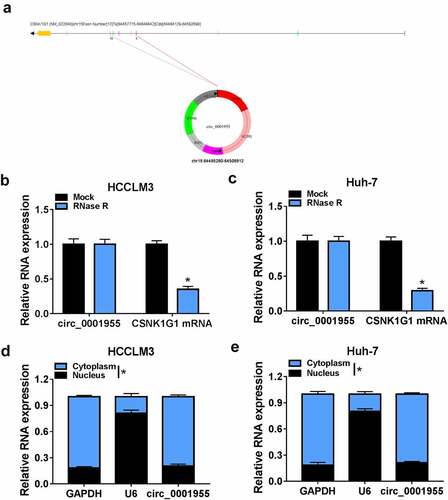
Figure 3. Knockdown of circ_0001955 restrains HCC tumorigenesis in vitro. (a-k) HCCLM3 and Huh-7 cells were transfected with si-circ_0001955 or si-NC. (a) qRT-PCR analysis of circ_0001955 expression in cells. (b-d) Cell proliferation analysis using CCK-8 and colony formation assays. (e, f) Transwell assay for cell migration and invasion. (g) Tube formation assay for cell angiogenesis analysis. (h-j) Flow cytometry for cell cycle distribution and cell apoptosis rate. (j, k) Western blot analysis of the protein levels of E-cadherin, vimentin and N-cadherin. *P < 0.05.
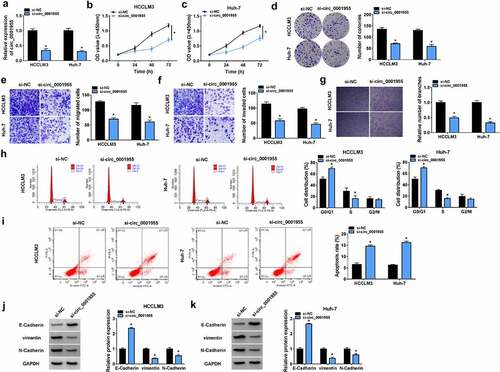
Figure 4. Circ_0001955 directly targeted miR-655-3p in HCC cells. (a) The binding site of miR-655-3p on circ_0001955 was predicted by software. (b) Detection of the transfection efficiency of miR-655-3p mimic or mimic negative control using qRT-PCR. (c-f) The interaction between miR-655-3p and circ_0001955 was analyzed by dual-luciferase reporter assay and RIP assay in HCCLM3 and Huh-7 cells. (g, h) qRT-PCR analysis of miR-655-3p expression level in HCC tissues and normal tissues (n =35), as well as in HCC cells and normal THLE-2 cells. (i) Detection of the transfection efficiency of miR-655-3p inhibitor or inhibitor negative control using qRT-PCR. (j, k) Measurement of miR-655-3p expression in HCCLM3 and Huh-7 cells transfected with si-NC, si-circ_0001955, si-circ_0001955 + anti-miR-NC, or si-circ_0001955 + anti-miR-655-3p using qRT-PCR. *P < 0.05.
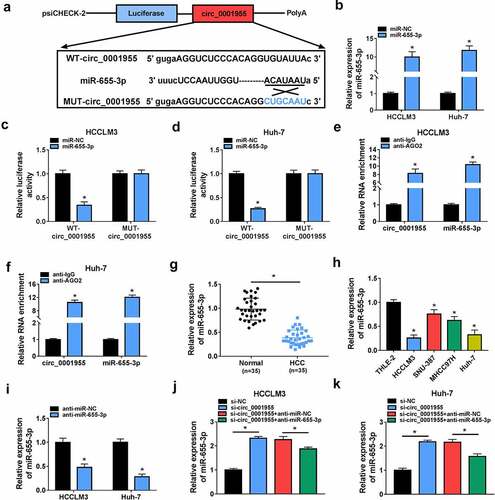
Figure 5. Knockdown of circ_0001955 suppresses HCC tumorigenesis via targeting miR-655-3p. (a-k) HCCLM3 and Huh-7 cells were transfected with si-NC, si-circ_0001955, si-circ_0001955 + anti-miR-NC, or si-circ_0001955 + anti-miR-655-3p. (a-c) Cell proliferation analysis using CCK-8 and colony formation assays. (d, e) Transwell assay for cell migration and invasion. (f) Tube formation assay for cell angiogenesis analysis. (g-i) Flow cytometry assay for cell cycle distribution and cell apoptosis rate. (j, k) Western blot analysis of the protein levels of E-cadherin, vimentin and N-cadherin. *P < 0.05.
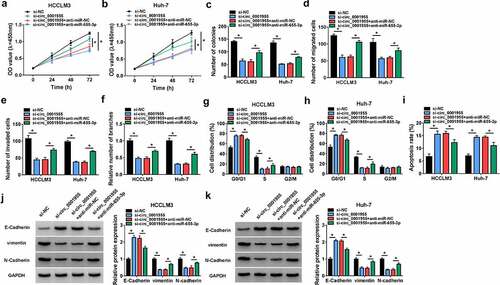
Figure 6. ACER3 is a target of miR-655-3p in HCC cells. (a) The binding site of miR-655-3p on ACER3 was predicted by software. (b-e) The interaction between miR-655-3p and ACER3 was analyzed by dual-luciferase reporter assay and RIP assay in HCCLM3 and Huh-7 cells. (f-h) qRT-PCR and Western blot analysis of ACER3 expression level in HCC tissues and normal tissues (n =35), as well as in HCC cells and normal THLE-2 cells. (i) Detection of the transfection efficiency of ACER3 or vector using Western blot. (j, k) Western blot analysis of ACER3 expression in HCCLM3 and Huh-7 cells transfected with miR-NC, miR-655-3p, miR-655-3p + vector, or miR-655-3p + ACER3. *P < 0.05.
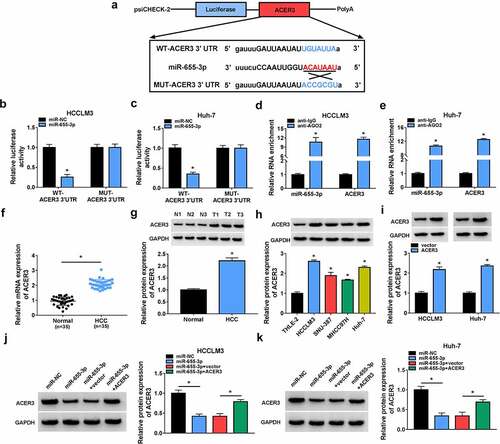
Figure 7. MiR-655-3p impedes HCC tumorigenesis via targeting ACER3. (a-k) HCCLM3 and Huh-7 cells were transfected with miR-NC, miR-655-3p, miR-655-3p + vector, or miR-655-3p + ACER3. (a-c) Cell proliferation analysis using CCK-8 and colony formation assays. (d, e) Transwell assay for cell migration and invasion. (f) Tube formation assay for cell angiogenesis analysis. (g-i) Flow cytometry assay for cell cycle distribution and cell apoptosis rate. (j, k) Western blot analysis of the protein levels of E-cadherin, vimentin and N-cadherin. *P < 0.05.
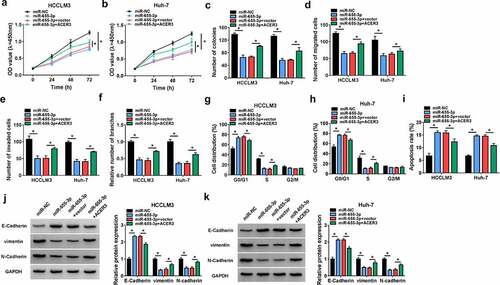
Figure 8. Circ_0001955 up-regulates ACER3 expression via inhibition of miR-655-3p. (a-d) qRT-PCR and Western blot analysis of ACER3 expression level in HCCLM3 and Huh-7 cells transfected with si-NC, si-circ_0001955, si-circ_0001955 + anti-miR-NC, or si-circ_0001955 + anti-miR-655-3p. *P < 0.05.
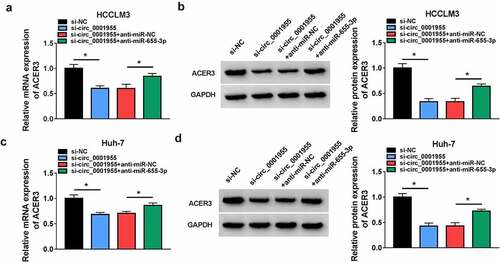
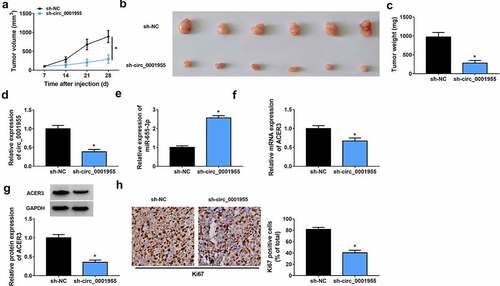
Figure 9. Silencing of circ_0001955 hinders HCC growth in vivo. (a) Tumor volume was measured every week. (b) Representative images of xenografts isolated from each group. (c) Tumor weight was measured at day 28. (d-f) qRT-PCR of circ_0001955, miR-655-3p and ACER3 expression in tumors of each group. (g) Western blot analysis of ACER3 protein expression in tumors of each group. (h) Representative IHC staining of Ki67 in the indicated xenografts and the corresponding statistical plots were presented in the right panel. *P < 0.05.