Figures & data
Figure 1. Inhibition of the proliferation of LC cells by melatonin in a concentration-dependent manner. *Compared with the control group, there existed a statistical significance, P < 0.05.
Figure 2. Inhibition of the proliferation of LC cells by melatonin (50 μM) in a time-dependent manner. *Compared with the control group, there existed a statistical significance, P < 0.05.
Figure 3. Effect of melatonin on cell cycle of LC cells. Control: the blank control group; Melatonin: the melatonin group. (a): the distribution of cells in each treatment group. (b): bar graphs with errors bars obtained from 3 replicates per cell cycle growth phase. *Compared with the control group, there existed a statistical significance, P < 0.05.
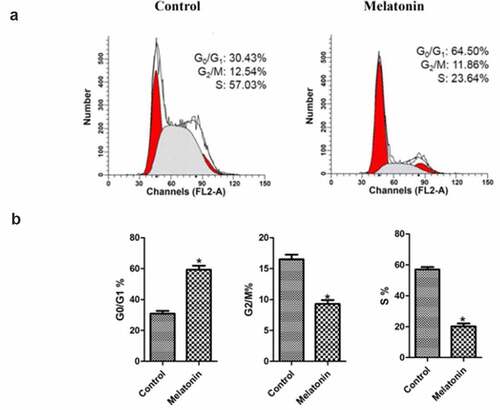
Figure 4. Effect of melatonin on colony formation of LC cells. Control: the blank control group; Melatonin: the melatonin group. (a): the plates. (b): the colony counts from the plates. *Compared with the control group, there existed a statistical significance, P < 0.05.
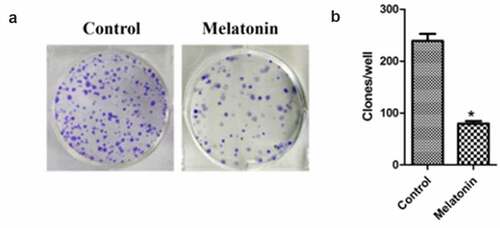
Figure 5. Effect of melatonin on apoptosis of LC cells. Control: the blank control group; Melatonin: the melatonin group. (a): Flow cytometry results. (b): bar graphs with errors bars. *Compared with the control group, there existed a statistical significance, P < 0.05.
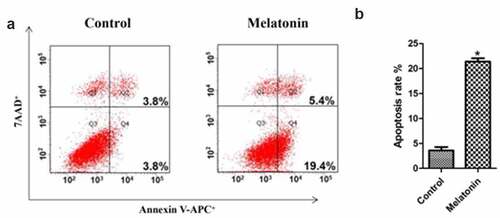
Figure 6. The results of TUNEL staining in the two groups of LC cells. Control: the blank control group; Melatonin: the melatonin group. (a): TUNEL results. (b): bar graphs with errors bars. *Compared with the control group, there existed a statistical significance, P < 0.05.
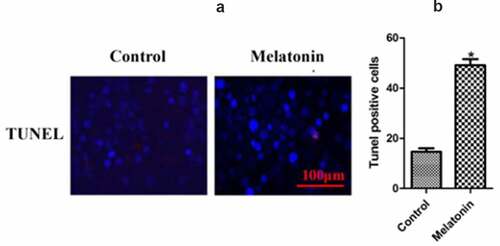
Figure 7. Effect of melatonin on the p38 MAPK signaling pathway in LC cells. Control: the blank control group; Melatonin: the melatonin group. (a): Western blot results. (b): bar graphs with errors bars. *Compared with the control group, there existed a statistical significance, P < 0.05.