Figures & data
Figure 1. The expression level of SNAI2, SCL7A11 and GPX4 in ovarian cancer. The expression level of SNAI2, SLC7A11 and GPX4 in human normal ovarian cell line IOSE-80 and multiple ovarian cancer cells (SKOV3, A2780 and CAOV3) were detected using (a-c) qRT-PCR and (d) Western blot, respectively. ***p < 0.001 vs IOSE-80.
Figure 2. The migration, invasion and ferroptosis in ovarian cancer. The human normal ovarian cell line IOSE-80 and multiple ovarian cancer cells (SKOV3, A2780 and CAOV3) were used for analysis. (a) Cell proliferation was detected using CCK-8 assay. (b-d) The invasion ability and migration ability of different cell lines were measured by Transwell assay and wound-healing assay, respectively. The content of (e) Fe2+, (f) MDA, (g) GSSG and (h) GSH were detected using their corresponding commercial kits. *p < 0.05, **p < 0.01, and ***p < 0.001 vs IOSE-80.
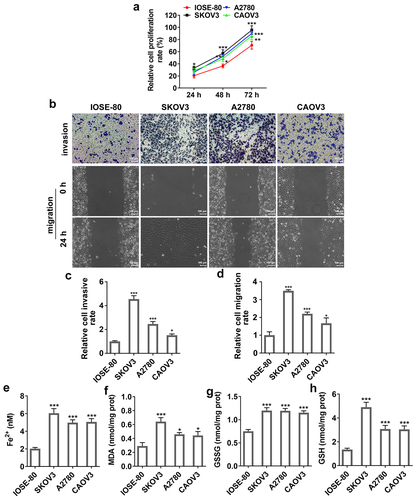
Figure 3. The effect of SNAI2 knockdown on cell migration, invasion and apoptosis in SKOV3 cells. (a) SKOV3 cells were transfected with shRNA-SNAI2-1/2 and its control (vector), and the mRNA level was detected using qRT-PCR 48 h after transfection. ***p < 0.001 vs vector. SKOV3 cells were transfected with shRNA-SNAI2 or vector, or received erastin treatment (30 μM). The (b) cell viability, (c-e) invasion and migration of different groups were analyzed by CCK-8, Transwell and wound-healing assays, respectively. (f)The protein expression level of Bcl-2, Bax and cleaved caspase3 was determined by Western blot assay. **p < 0.01, and ***p < 0.001 vs control; ###p < 0.001 vs vector.
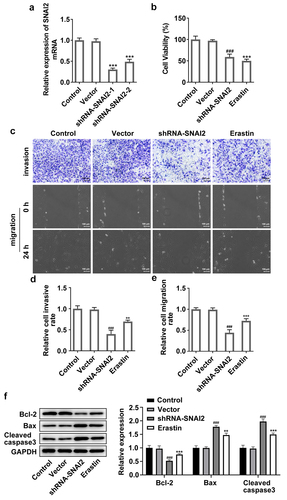
Figure 4. The effect of SNAI2 knockdown on ferroptosis in SKOV3 cells. SKOV3 cells were transfected with shRNA-SNAI2 or vector, or received erastin treatment. The content of (a-b) Fe2+, (c) MDA, (d) GSSG and (e) GSH were detected using their corresponding commercial kits. (f) The protein expression of GPX4, SLC7A11, and ACSL4 was measured using Western blot. (g) The protein expression of NCOA4, TFR1, and DMT1 was measured using Western blot. **p < 0.01, and ***p < 0.001 vs control; #p < 0.05, ##p < 0.01, and ###p < 0.001 vs vector.
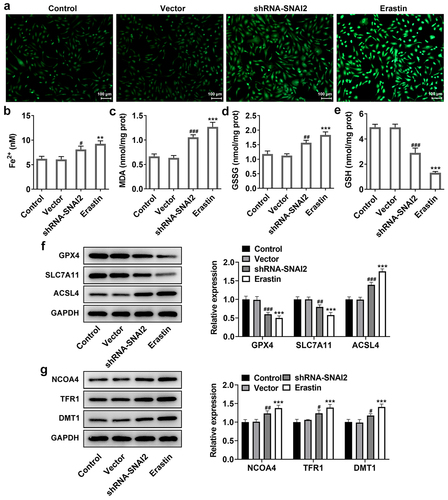
Figure 5. The relationship between SNAI2 and SLC7A11. (a) The potential binding site between SNAI2 and SLC7A11 promoter was predicted by JASPAR bioinformatics website (http://jaspar.genereg.net/). (b) SKOV3 cells were transfected with pcDNA3.1 or pcDNA3.1-SNAI2, and the protein expression level of SNAI2 was measured by Western blot. (c) SKOV3 cells were co-transfected with SLC7A11-WT/SLC7A11-MUT and pcDNA3.1 or pcDNA3.1-SNAI2 using Lipofectamine 3000, and the luciferase activity was examined using dual-luciferase reporter assay kit. ***p < 0.001 vs pcDNA3.1. (d) Chromatin immunoprecipitation (ChIP) assay was performed and the precipitated DNA was detected by qRT-PCR. ***P < 0.001 vs IgG.
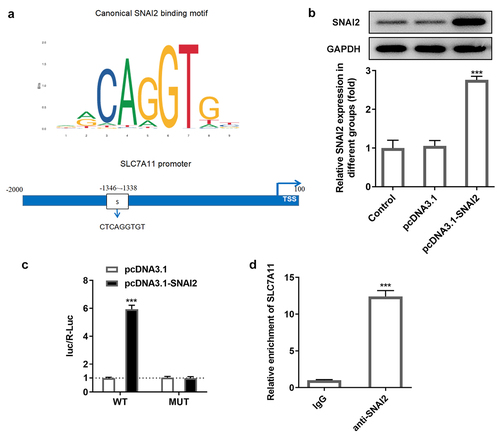
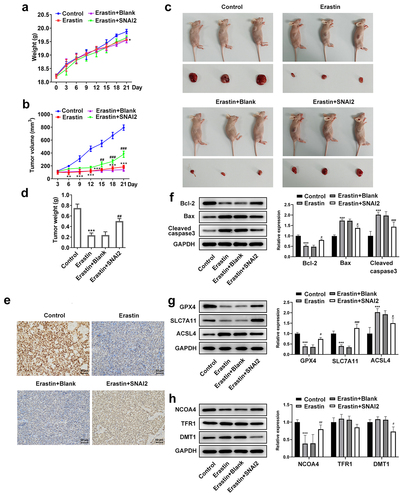
Figure 6. The effect of erastin and SNAI2 overexpression on tumor growth of ovarian cancer in vivo. Mice were subcutaneously injected with untransfected or transfected SKOV3 cells to induce tumor formation. Erastin (30 mg/kg intraperitoneally) was applied for treatment. Before sacrifice, the (a) mice weight and (b) tumor volume were monitored and recorded every 3 days. (c) After sacrifice, the tumors were harvested and the tumor size was observed. (d) The tumor weight was also recorded. (e) Immunohistochemical (IHC) assay was conducted to detect the expression of SLC7A11 of tumor tissue. (f) The protein expression of Bcl-2, Bax, and cleaved caspase3 was determined using Western blot. (g) The protein expression of GPX4, SLC7A11, and ACSL4 was determined using Western blot. (h) The protein expression of NCOA4, TFR1, and DMT1 was determined using Western blot. **p < 0.01, and ***p < 0.001 vs control; #p < 0.05, ##p < 0.01, and ###p < 0.001 vs Erastin+pcDNA3.1.