
Figures & data
Table 1. Primer sequences
Table 2. Relationship between PROX1 expression and clinical characteristics of OS patients
Figure 1. PROX1 expression was upregulated in OS tissues. (a) OS tissue with PROX1 high expression. (b) OS tissue with PROX1 moderately expression. (c) OS tissue with PROX1 weakly or negative expression. (d-e) The expression of PROX1 in normal bone tissue adjacent to the tumor and control OS group. OS, osteosarcoma.
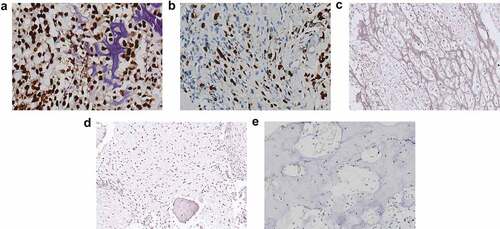
Figure 2. High PROX1 expression predicted poor prognosis in OS patients. (a) The correlationship between PROX1 expression and metastasis in OS patients. (b) The overall survival of OS patients with high and low expression of PROX1. OS, osteosarcoma.
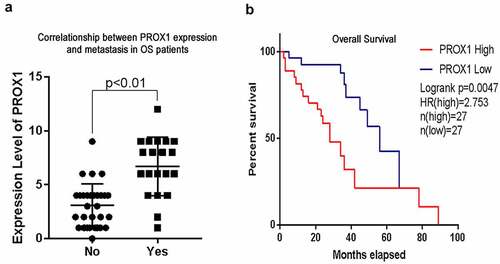
Figure 3. Effects of PROX1 knockdown on cell proliferation in OS cells. (a-b) qRT-PCR and Western blot analysis showed PROX1 expression in human osteoblast cell line (hFOB1.19) and four glioma cell lines (143B, U2OS, HOS and SAOS2). (c) The relative siPROX1 expression in 143B cell. (d) Proliferation in 143B cell was detected by CCK8 assay. OS, osteosarcoma. (*p < 0.05, **p < 0.01, ***p < 0.001).
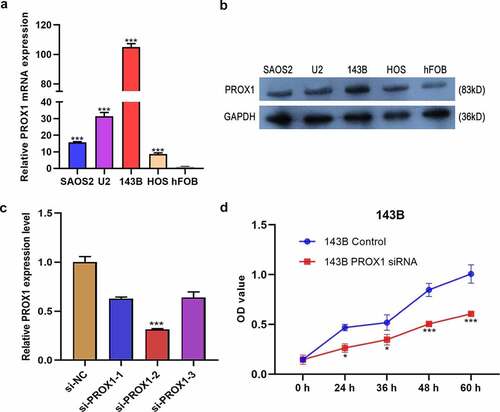
Figure 4. Effects of PROX1 knockdown and overexpression on the migration and invasion of OS cells. (a) Wound healing assay was used to detect the cell migration ability after PROX1 knockdown or overexpression of 48 h in 143B cell. (b-c) Transwell assay showed the invasion of 143B cells after transfection with PROX1 siRNA or overexpression plasmid. OS, osteosarcoma.
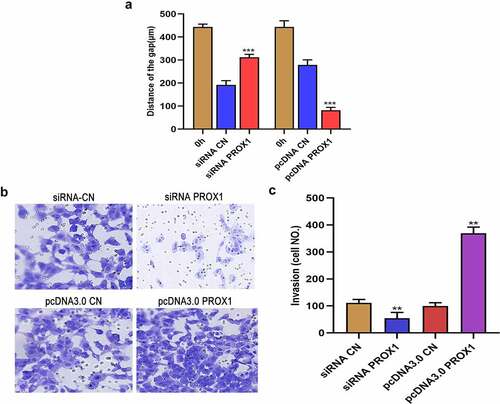
Figure 5. The hierarchical aggregation analysis of DEGs in different samples. DEGs, differentially expressed genes.
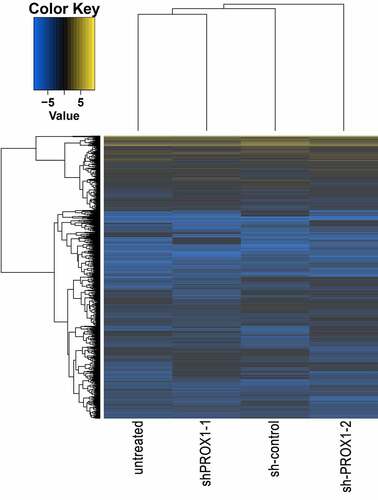
Figure 6. The results of GO and KEGG enrichment analysis of DEGs. (a) The results of GO analysis of DEGs. GO, gene ontology; BP, biological process; CC, cellular component; MF, molecular function. (b) KEGG enrichment analysis results of DEGs. KEGG, Kyoto Encyclopedia of Genes and Genomes. DEGs, differentially expressed genes.
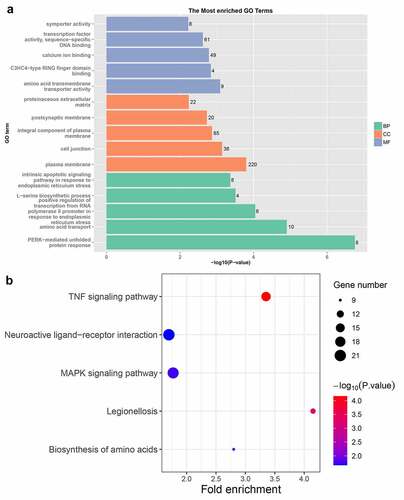
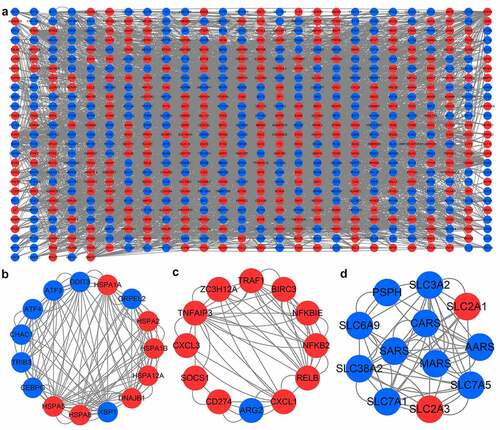
Figure 7. PPI network and important modules of DEGs. (a) The PPI network of DEGs. The red circles represent upregulated DEGs and blue circles represent downregulated DEGs. (b) The module 1 from the PPI network. (c) The module 2 from the PPI network. (d) The module 3 from the PPI network. PPI, protein-protein interaction; DEGs, differentially expressed genes.
Supplemental Material
Download Zip (1.1 MB)Data availability statement
The data used to support the findings of this study are available from the corresponding author upon request.
The datasets used and/or analyzed during the current study are available from the corresponding author on reasonable request.