Figures & data

Figure 1. IFIT1 was highly expressed in OCs. (a) Six overlapping genes, including IFIT1, were found to be upregulated in the GSE51588, GSE1919, and GSE75181 datasets. (b) Raw264.7 cells were treated with 50 ng/mL M-CSF and different concentrations of RANKL for six days. The gene expression of IFIT1 was determined using qRT-PCR. (c) The protein expression of IFIT1 was determined using Western blotting analysis. (d) Raw264.7 cells were treated with 50 ng/mL M-CSF and 50 ng/mL RANKL for 0–12 days. The gene expression of IFIT1 was determined using qRT-PCR. (e) The protein expression of IFIT1 was determined using Western blotting analysis. ns, no significance vs. control group or the indicated. *P < 0.05 vs. control group.
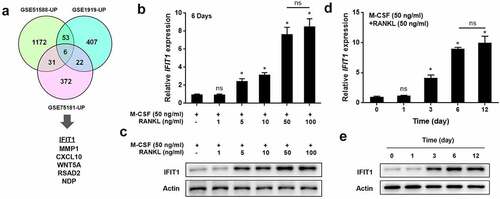
Figure 2. Overexpression of IFIT1 accelerated OC formation induced by RANKL. (a) Raw264.7 cells were transfected with PCMV6-IFIT1 or the empty vector. Expression level of IFIT1 gene was determined using qRT-PCR. (b) Protein expression level of IFIT1 was determined using Western blotting analysis. (c) The transfected Raw264.7 cells were treated with 50 ng/mL M-CSF and 50 ng/mL RANKL for six days. The representative image of TRAP staining. (d) The number of multinucleate cell (≥ 3 nuclei) from TRAP staining. (e) Cell size from TRAP staining. (f) The representative image of Western blotting analysis. Quantitative levels of (g) ATP6V0D2, (h) DC-STAMP, (i) ATP6i, (j) CTSK, (k) TRAP, (l) NFATc1, (m) c-Fos, and (n) MMP9 proteins. *P < 0.05 vs. control group. #P < 0.05 vs. RANKL+Vector group.
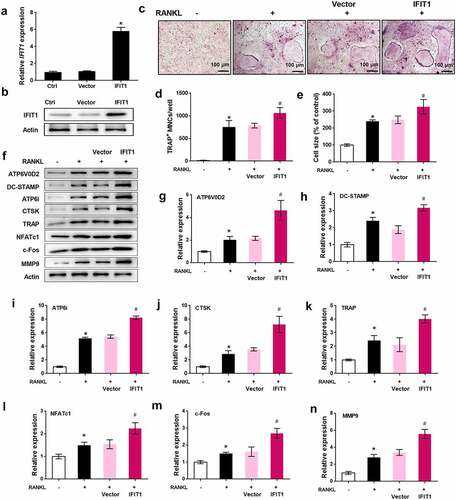
Figure 3. Silence of IFIT1 inhibited OC formation induced by RANKL. (a) Raw264.7 cells were transfected with si-IFIT1 or the negative control (si-NC). Expression level of IFIT1 gene was determined using qRT-PCR. (b) Protein expression level of IFIT1 was determined using Western blotting analysis. (c) The transfected Raw264.7 cells were treated with 50 ng/mL M-CSF and 50 ng/mL RANKL for six days. The representative image of TRAP staining. (d) The number of multinucleate cell (≥ 3 nuclei) from TRAP staining. (e) Cell size from TRAP staining. (f) The representative image of Western blotting analysis. Quantitative levels of (g) ATP6V0D2, (h) DC-STAMP, (i) ATP6i, (j) CTSK, (k) TRAP, (l) NFATc1, (m) c-Fos, and (n) MMP9 proteins. *P < 0.05 vs. control group. #P < 0.05 vs. RANKL+si-NC group.
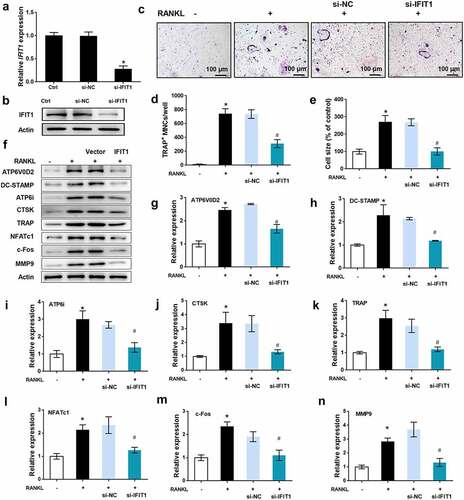
Figure 4. STAT3 was a downstream pathway of IFIT1. (a) STAT3 signaling pathway activated by IFIT1 was obtained by GSEA analysis. (b) Raw264.7 cells were transfected with PCMV6-IFIT1, si-IFIT1 or the negative controls. After transfection, cells were treated with 50 ng/mL M-CSF and 50 ng/mL RANKL for six days. Western blot was used to measure the expression of JAK1, STAT3 and the phosphorylated forms of the two proteins. (c) Fold change of phosphorylated JAK1 and STAT3 relative to total proteins. *P < 0.05 vs. control group. #P < 0.05 vs. the indicated group.
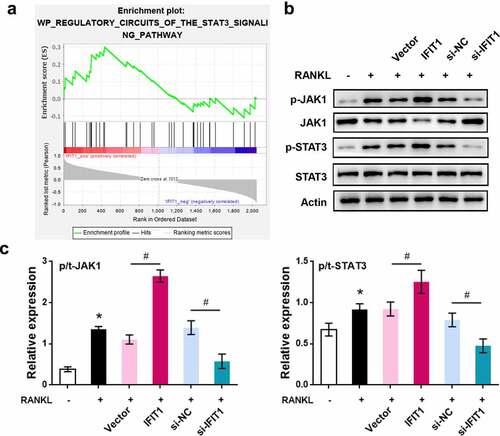
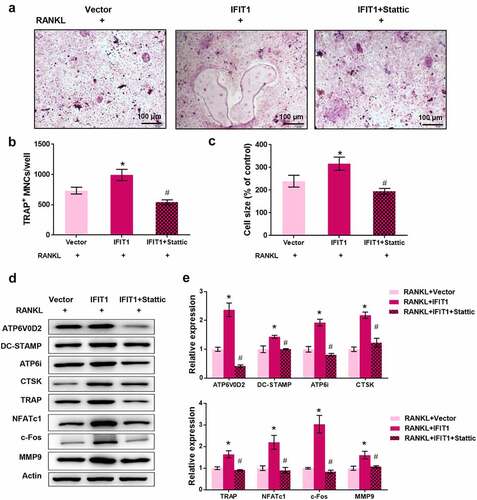
Figure 5. IFIT1 promoted OC formation by activating STAT3 signaling. (a) Raw264.7 cells were transfected with PCMV6-IFIT1 or the empty vector. After transfection, cells were treated with 50 ng/mL M-CSF and 50 ng/mL RANKL for six days. Stattic with a dose of 3 μM was used to treat cells for 24 h to inhibit STAT3 signaling. The representative image of TRAP staining. (b) The number of multinucleate cell (≥ 3 nuclei) from TRAP staining. (c) Cell size from TRAP staining. (d) The representative image of Western blotting. (e) Quantitative levels of ATP6V0D2, DC-STAMP, ATP6i, CTSK, TRAP, NFATc1, c-Fos, and MMP9 proteins obtained from Western blotting analysis. *P < 0.05 vs. RANKL+Vector group. #P < 0.05 vs. RANKL+IFIT1 group.