Figures & data
Table 1. Primer sequences for qRT-PCR
Figure 1. Smurf1 is highly expressed in CHF rats. A: Cardiac function indexes after modeling were detected by echocardiography; B: The ratios of heart weight/body weight, left ventricle weight/body weight, and lung weight/body weight were measured; C: Histopathological changes of the myocardium observed by HE staining; D: Masson staining observed the degree of myocardial tissue fibrosis; E: Expression of Smurf1 in myocardial tissue detected by qRT-PCR; F: Smurf1 protein level in myocardial tissue detected by WB; G: Expression of Smurf1 in the myocardium was detected by immunohistochemical staining; N = 10; Values in the figure were measurement data, which were displayed as mean ± standard deviation. Unpaired t test was used for comparisons. * P < 0.05.
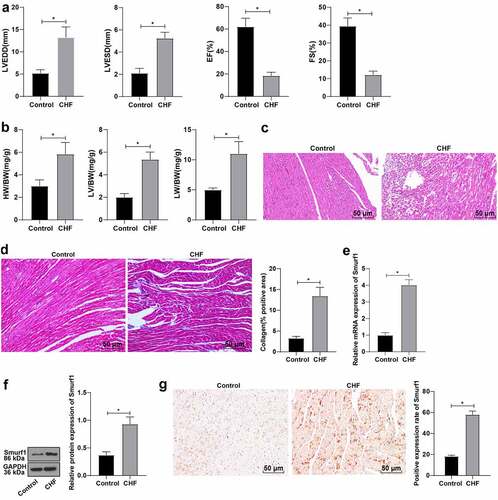
Figure 2. Smurf1 silencing inhibits oxidative stress levels and improves cardiac function in CHF rats. A: Smurf1 expression in myocardial tissue of rats detected by qRT-PCR and WB; B: Cardiac function indexes after modeling were detected by echocardiography; C: The ratios of heart weight/body weight, left ventricle weight/body weight, and lung weight/body weight were measured; D: Histopathological changes of the myocardium observed by HE staining; E: Masson staining observed the degree of myocardial tissue fibrosis; F: The levels of SOD, GSH-Px and MDA detected by ELISA; N = 10; Values in the figure were measurement data, which were displayed as mean ± standard deviation. Unpaired t test was used for comparisons. * P < 0.05.
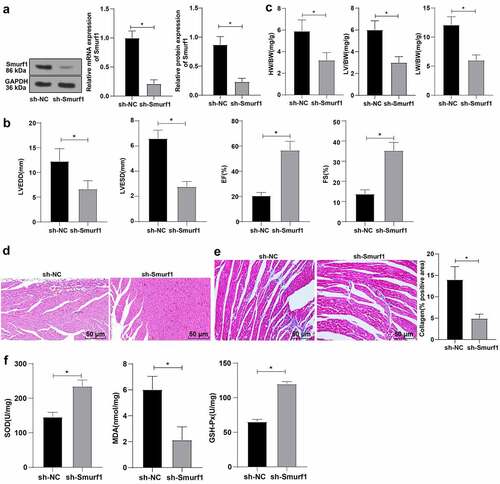
Figure 3. Smurf1 is the target gene of miR-129-5p. A: Starbase website predicted the targeted binding sites of miR-129-5p and Smurf1; B: The targeting relationship between miR-129-5p and Smurf1 verified by dual-luciferase assay; C: miR-129-5p expression in the myocardium of CHF rats detected by qRT-PCR; D: Smurf1 expression after miR-129-5p overexpression and interference with miR-129-5p detected by qRT-PCR; E: Smurf1 protein level detected by WB after miR-129-5p overexpression and interference with miR-129-5p; Values in the figure were measurement data and displayed as mean ± standard deviation. Unpaired t test was used for pairwise comparisons; one-way ANOVA was used for comparisons among multiple groups, followed by Tukey’s test. * P < 0.05.
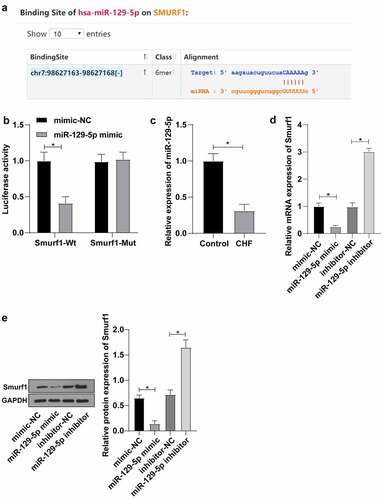
Figure 4. miR-129-5p affected cardiac function in CHF rats through Smurf1. A-B: The levels of Smurf1 in myocardial tissue of rats detected by qRT-PCR and WB; C: The ratios of heart weight/body weight, left ventricle weight/body weight, and lung weight/body weight were measured; D: Histopathological changes of the myocardium observed by HE staining; E: Masson staining observed the degree of myocardial tissue fibrosis; F: The levels of SOD, GSH-Px and MDA detected by ELISA; N = 10; Values in the figure were measurement data and displayed as mean ± standard deviation. Unpaired t test was used for pairwise comparisons; one-way ANOVA was used for comparisons among multiple groups, followed by Tukey’s test. * P < 0.05.
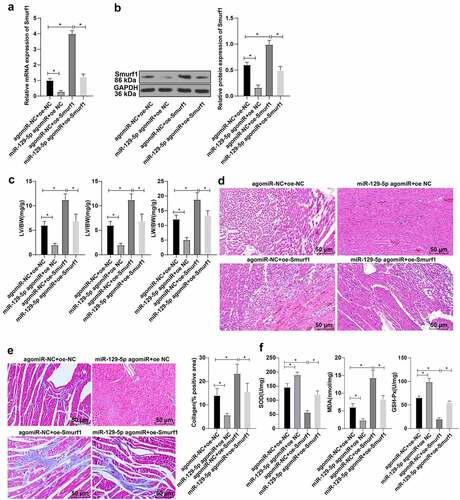
Figure 5. E3 ubiquitin ligase Smurf1 affects PTEN expression through ubiquitination. A: WB detected the PTEN protein level in myocardial tissues of CHF rats; B: IP experiment found that Smurf1 could be combined with PTEN; C: IP test was used to detect the changes of PTEN ubiquitination after Smurf1 silencing; D: The changes of PTEN ubiquitination after Smurf1 overexpression were detected by IP; E: Expressions of Smurf1 and PTEN in cells detected by WB; N = 10; Values in the figure were measurement data and displayed as mean ± standard deviation. Unpaired t test was used for pairwise comparisons; one-way ANOVA was used for comparisons among multiple groups, followed by Tukey’s test. * P < 0.05.
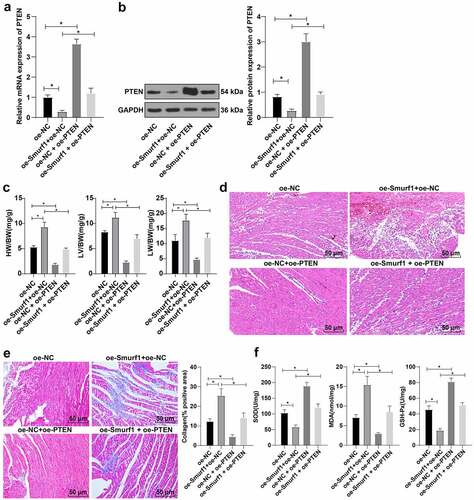
Figure 6. Smurf1 affects cardiac function in CHF rats through PTEN. AB: qRT-PCR and WB were used to detect the protein level of PTEN in myocardial tissues of CHF rats; C: The ratios of heart weight/body weight, left ventricle weight/body weight, and lung weight/body weight were measured; D: Histopathological changes of the myocardium observed by HE staining; E: Masson staining observed the degree of myocardial tissue fibrosis; F: The levels of SOD, GSH-Px and MDA detected by ELISA; N = 10; Values in the figure were measurement data and displayed as mean ± standard deviation. Unpaired t test was used for pairwise comparisons; one-way ANOVA was used for comparisons among multiple groups, followed by Tukey’s test. * P < 0.05.