Figures & data
Figure 1. LHFPL3-AS1 is high-expressed in NPC tissues and cells and is associated with shorter OS. (a) LHFPL3-AS1 level in NPC tissues was detected by RT-qPCR; (b) LHFPL3-AS1 levels in NPC cell lines were examined by RT-qPCR; (c) Relation curve between LHFPL3-AS1 expression and OS of NPC patients. The data was expressed as mean ± standard deviation. * P < 0.05 vs. the NP69 cells.
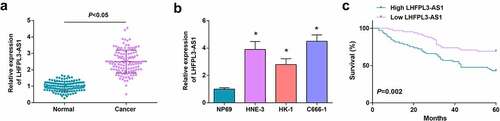
Figure 2. Silenced LHFPL3-AS1 inhibits radiation-resistant NPC cell growth in vitro and tumor growth in vivo. (a) RT-qPCR was used to detect the expression of LHFPL3-AS1 in both parent and resistant strains; (b). cell proliferation ability of parental and resistant strains was evaluated by CCK-8 assay; (c) LHFPL3-AS1 expression in NPC cells after the down-regulation of LHFPL3-AS1 was detected by RT-qPCR; (d) Proliferation of NPC cells after the down-regulation of LHFPL3-AS1 was examined by CCK-8 assay; (e) Colony formation ability of NPC cells after the down-regulation of LHFPL3-AS1 was assessed by colony formation assay; (f,g) Migration and invasion of NPC cells after the down-regulation of LHFPL3-AS1 were detected by Transwell assay; (h) Apoptosis of NPC cells after the down-regulation of LHFPL3-AS1 was detected by flow cytometry; (i) The weight and volume of the tumor were detected in nude mice. The data iwas expressed as mean ± standard deviation. * P < 0.05 vs. C666-1 cells; # P < 0.05 vs. the si-NC group.
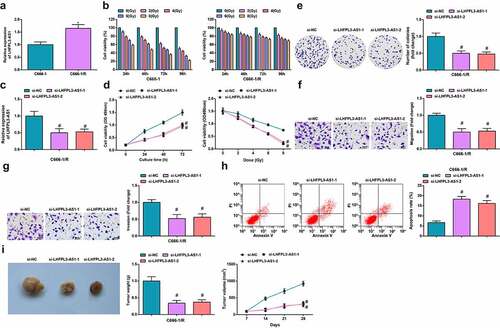
Figure 3. LHFPL3-AS1 binds to miR-143-5p. (a) The presence of binding sites between LHFPL3-AS1 and miR-143-5p was predicted by Jefferson website; (b) Binding relation between LHFPL3-AS1 and miR-143-5p was validated by dual luciferase reporter gene assay; (c) enrichment levels of LHFPL3-AS1 and miR-143-5p were detected by RIP assay; (d) miR-143-5p expression in NPC cell lines after the silencing of LHFPL3-AS1 was examined by RT-qPCR. The data was expressed as mean ± standard deviation. & P < 0.05 vs. the si-NC group.
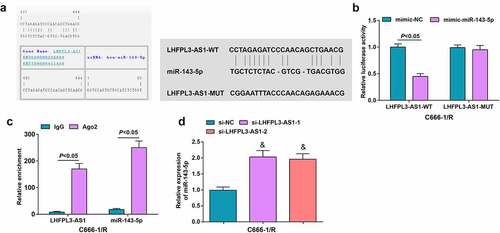
Figure 4. Up-regulated miR-143-5p retards the biological function of NPC cells. (a) miR-143-5p expression in NPC cells after X-ray irradiation treatment was detected by RT-qPCR; (b) miR-143-5p expression in NPC cells after the up-regulation of miR-143-5p was detected by RT-qPCR; (c) proliferation of NPC cells after the up-regulation of miR-143-5p was examined by CCK-8 assay; (d) colony formation ability of NPC cells after the up-regulation of miR-143-5p was assessed by colony formation assay; (e,f) Migration and invasion of NPC cells after the up-regulation of miR-143-5p were detected by Transwell assay; (g) Apoptosis of NPC cells after the up-regulation of miR-143-5p was detected by flow cytometry. The data was expressed as mean ± standard deviation.# P < 0.05 vs. the mimic-NC group; * P < 0.05 vs. C666-1 cells.
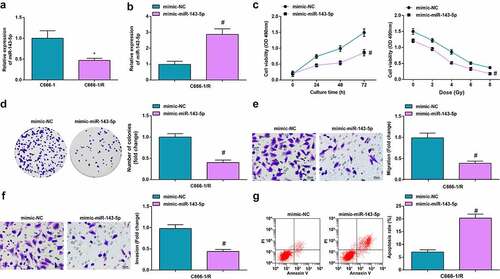
Figure 5. MiR-143-5p targets HOXA6. (a) Binding sites between miR-143-5p and HOXA6 were predicted by Targetscan; (b) Targeting relation between miR-143-5p and HOXA6 was validated by dual luciferase reporter gene assay; (c) HOXA6 expression was detected byWestern blot analysis. The data was expressed as mean ± standard deviation. % P < 0.05 vs. the mimic-NC group; $ P < 0.05 vs. the si-NC group.
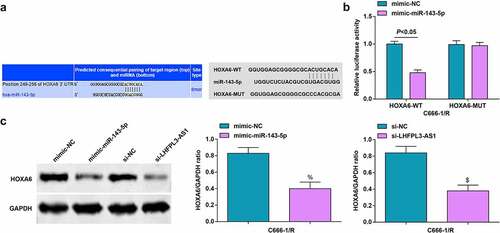
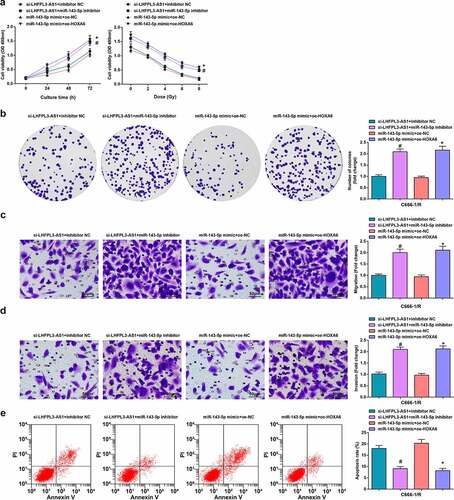
Figure 6. Down-regulated LHFPL3-AS1 hinders the development of NPC via miR-143-5p/HOXA6 axis. (a) Proliferation of NPC cells was examined by CCK-8 assay; (b) Colony formation ability of NPC cells was assessed by colony formation assay; (c,d) Migration and invasion of NPC cells were detected by Transwell assay; E, apoptosis of NPC cells was detected by flow cytometry. The data was expressed as mean ± standard deviation.# P < 0.05 vs. the si-LHFPL3-AS1 +inhibitor NC group; * P < 0.05 vs. the miR-143-5p mimic + oe-NC group.