Figures & data
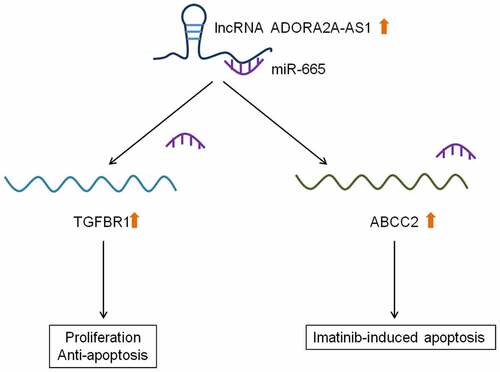
Figure 1. The expression of ADORA2A-AS1 is upregulated in CML. The expression of ADORA2A-AS1 in CML patients (n = 13) and healthy individuals (n = 10) by qRT-PCR.
Figure 2. Knockdown of ADORA2A-AS1 inhibits cell proliferation. (a) Transcript levels of ADORA2A-AS1 in K562 and KCL22 cells transfected with control siRNA or ADORA2A-AS1 siRNA. (b) Representative CCK8 proliferation assays in K562 and KCL22 cells. (c) Representative EDU staining (left) and quantitation (right) in K562 and KCL22 cells. **P < 0.01, ***P < 0.001.
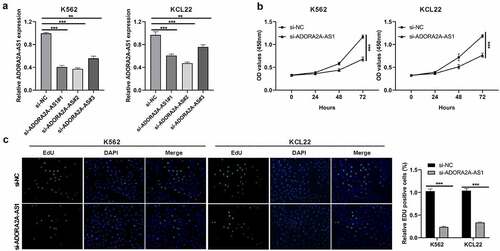
Figure 3. Knockdown of ADORA2A-AS1 induces CML cell apoptosis and cell cycle arrest. Cell apoptosis assay in K562 (a) and KCL22 (b) cells, analyzed by flow cytometry. (c) Cell apoptosis-related proteins, measured by Western blot. (d) Cell cycle-related proteins, measured by Western blot. Cell cycle analysis in K562 (e) and KCL22 (f) cells, analyzed by flow cytometry. ***P < 0.001.
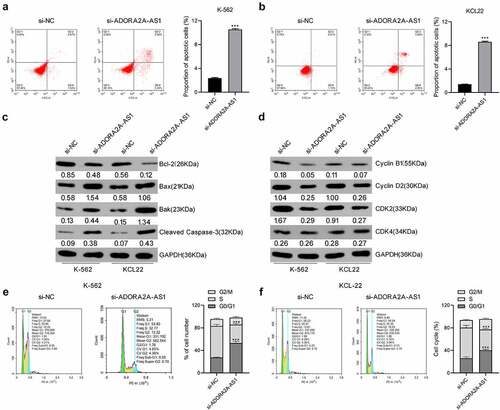
Figure 4. ADORA2A-AS1 acts as an endogenous sponge for miR-665. (a) The predicted binding sequence of miR-665 on ADORA2A-AS1, and the mutants of ADORA2A-AS1 and miR-665. (b) The relative luciferase activity in HEK 293 T cells cotransfected with ADORA2A-AS1-WT or ADORA2A-AS1-MUT reporter and miR-665 mimics or mimics control. RIP assay was performed in K562 (c), and KCL22 (d) cell extracts to examine miR-665 endogenously associated with ADORA2A-AS1. qRT-PCR was used to examine the expression of miR-665 in K562 (e) and KCL22 (f) cells transfected with si-ADORA2A-AS1 or si-control. (g) The expression of miR-665 in healthy donors and CML patients. **P < 0.01, ***P < 0.001.
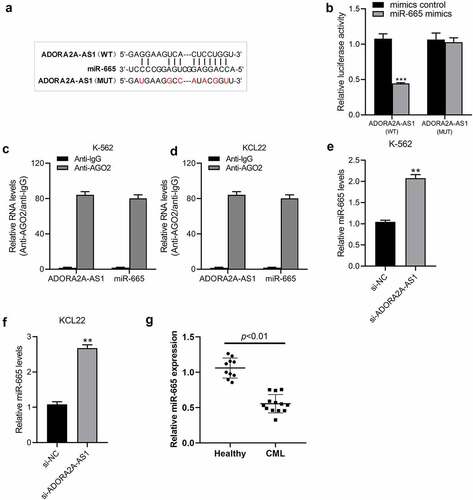
Figure 5. miR-665 counteracts the malignant properties of ADORA2A-AS in CML cells. (a, b) The expression of miR-665 in K562 and KCL22 cells transfected with miR-665 mimics or mimic control. K562 and KCL22 cells were co-transfected with miR-665 mimic and pcDNA3.1-ADORA2A-AS or alone, and subjected to (c, d) CCK8 assay for cell proliferation, (e) flow cytometry for cell apoptosis analysis, and (f) flow cytometry for cell cycle analysis. *P < 0.05, **P < 0.01, ***P < 0.001;. #P < 0.05, ##P < 0.01.
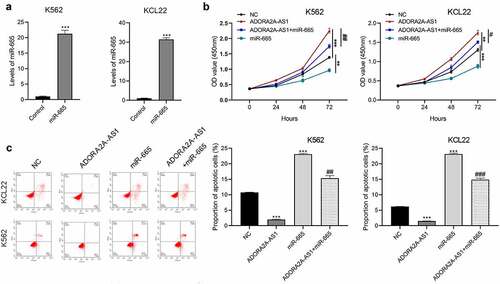
Figure 6. ADORA2A-AS1 promotes TGFBR1 and ABCC2 expression by adsorbing miR-665. (a) Western blot was used to determine TGFBR1 and ABCC2 protein levels in K562 and KCL22 cells transfected with miR-665 mimics or inhibitors. (b) Western blot was performed to determine TGFBR1, and ABCG1 protein levels in K562 and KCL22 cells transfected with miR-665 mimics si-ADORA2A-AS1 or combination. ***P < 0.001.
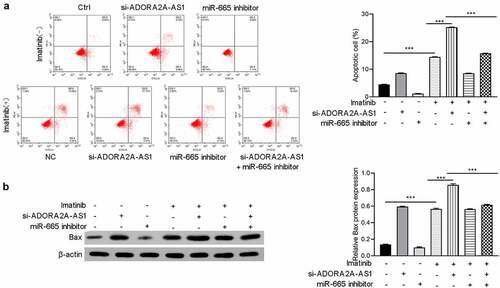
Figure 7. ADORA2A-AS1 affected imatinib sensitivity. After transfection with si-ADORA2A-AS1, miR-665 mimics or combination, K562 cells were treated with imatinib. (a) Cell apoptosis analyses were performed in each group. (b) Western blot was performed to detect Bax protein expression. ***P < 0.001.