
Figures & data
Figure 1. Cytotoxicity of Butorphanol tartrate in human HC-A chondrocytes. (a) Molecular structure of Butorphanol tartrate; (b). Cells were treated with Butorphanol tartrate at varying concentrations (0, 0.5, 1, 2, 4, 20, 40 μM) for 24 hours, the cell viability was determined (†, ††, P < 0.05, 0.01 vs. Control group).
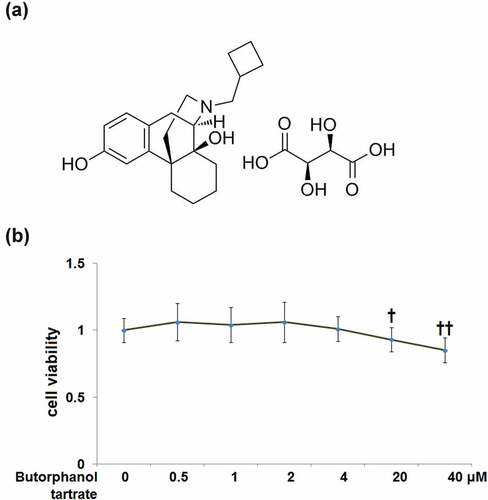
Figure 2. The effects of Butorphanol tartrate on cellular senescence induced by TNF-α in HC-A chondrocytes. The cells were treated with Butorphanol tartrate (2, 4 μM) and TNF-α (20 ng/ml) for 14 days. (a). Representative pictures of the SA-β-gal staining results in the sham group and experimental groups; (b). Quantification of the SA-β-gal staining; (c). Telomerase activity (‡‡, P < 0.01 vs. Control group; †, ††, P < 0.05, 0.01 vs. TNF-α group).
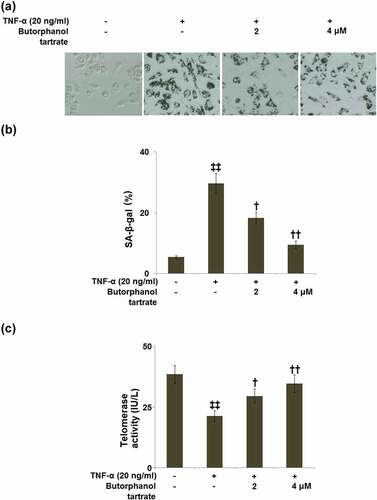
Figure 3. The effects of Butorphanol tartrate on cell cycle arrest in the G0/G1 phase in TNF-α-treated HC-A chondrocytes. The cells were treated with Butorphanol tartrate (2, 4 μM) and TNF-α (20 ng/ml) for 14 days. The percentage of G0/G1-phase was shown in the results (‡‡, P < 0.01 vs. Control group; †, ††, P < 0.05, 0.01 vs. TNF-α group).
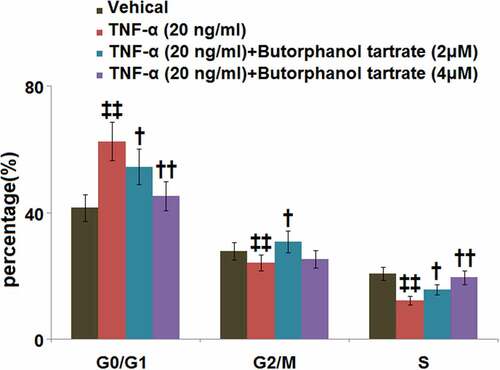
Figure 4. The effects of Butorphanol tartrate on the expression of p21 in HC-A chondrocytes against TNF-α. The cells were treated with Butorphanol tartrate (0, 2, 4 μM) and TNF-α (20 ng/ml) for 24 hours. (a). mRNA of p21; (b). Protein of p21 (‡‡, P < 0.01 vs. Control group; †, ††, P < 0.05, 0.01 vs. TNF-α group).
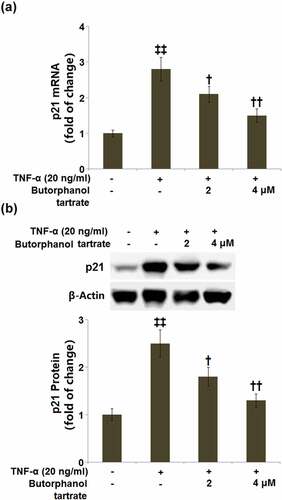
Figure 5. The effects of Butorphanol tartrate on TNF-α-induced inflammation in HC-A chondrocytes. The cells were treated with Butorphanol tartrate (0, 2, 4 μM) and TNF-α (20 ng/ml) for 24 hours. (a) The mRNA level of IL-6 and IL-8; (b) secretions of IL-6 and IL-8 (‡‡, P < 0.01 vs. Control group; †, ††, P < 0.05, 0.01 vs. TNF-α group).
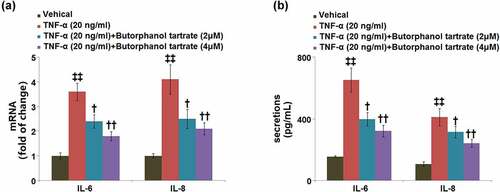
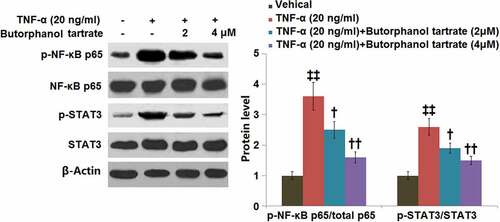
Figure 6. The effects of Butorphanol tartrate on the activation of NF-κB and STAT3 in HC-A chondrocytes against TNF-α. The cells were treated with Butorphanol tartrate (2, 4 μM) and TNF-α (20 ng/ml) for 24 hours. Representative Western blot results of p-NF-κB p65/total p65 and p-STAT3/STAT3 (‡‡, P < 0.01 vs. Control group; †, ††, P < 0.05, 0.01 vs. TNF-α group).
Data availability statement /availability of data materials
Data of this study are available upon reasonable request to the corresponding authors.