Figures & data

Table 1. Primers for real-time PCR
Figure 1. Effect of Timosaponin BII (TB-II) on IL-1β-induced SW1353 cell and chondrocyte viability and reactive oxygen species (ROS) production. (a) The chemical structure of TB-II. (b, c) The effect of TB-II on SW1353 cell and chondrocyte viability was determined by the CCK-8 assay. (d, e) ROS levels were detected and quantified. One-way ANOVA, ##p < 0.01, compared with control cells; $$p < 0.01, ns: not-significant, compared with IL-1β-treated cells.
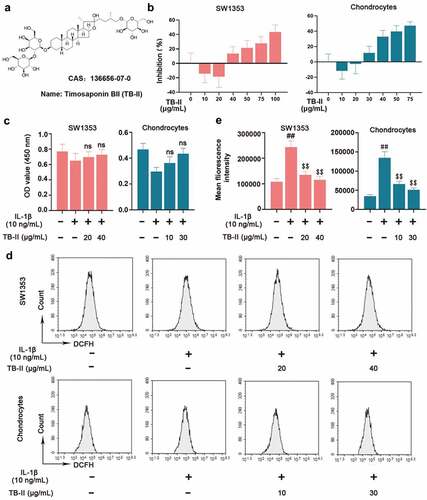
Figure 2. TB-II inhibited the production of oxidant markers in IL-1β-treated SW1353 cells and chondrocytes. The mRNA expression of (a) iNOS and (b) COX-2 were detected by qRT-PCR. (c, d) The protein level of iNOS and COX-2 was detected by Western blot and quantified. GAPDH was conducted as a loading control. The levels of (e) NO and (f) PGE2 were determined using ELISA. One-way ANOVA, ##p < 0.01, compared with control cells; $p < 0.05, $$p < 0.01, ns: not-significant, compared with IL-1β-treated cells.
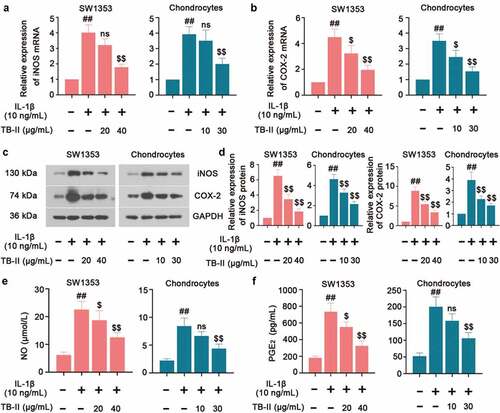
Figure 3. TB-II inhibited the production of inflammatory cytokines in IL-1β-treated SW1353 cells and chondrocytes. The levels of (a) TNF-α, (b) IL-6 and (c) MCP-1 were determined using ELISA. One-way ANOVA, ##p< 0.01, compared with control cells; $p< 0.05, $$p< 0.01, ns: not-significant, compared with IL-1β-treated cells.
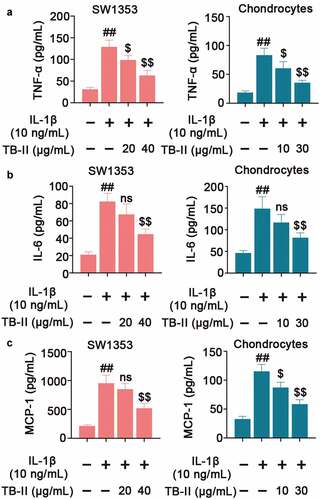
Figure 4. TB-II inhibited the production of cartilage degrading enzymes in IL-1β-treated SW1353 cells and chondrocytes. The mRNA expression of (a) MMP-1, (b) MMP-3 and (c) MMP-13 were detected by qRT-PCR. (d-g) The protein level of MMP-1, MMP-3, and MMP-13 were detected by Western blot. GAPDH was conducted as a loading control. One-way ANOVA, ##p < 0.01, compared with control cells; $p < 0.05, $$p < 0.01, ns: not-significant, compared with IL-1β-treated cells.
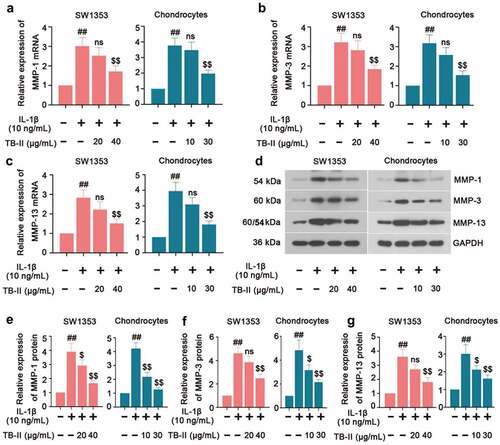
Figure 5. TB-II inhibited MAPK and NF-κB signaling pathways in IL-1β-treated SW1353 cells. (a, b) The protein expression of p-p65, p65, p-ERK1/2, ERK1/2, p-p38, p38, p-JNK, and JNK were determined by Western blot and quantified. GAPDH was conducted as a loading control. (c) The nuclei translocation of p65 (red) was detected by the immunofluorescence assay. Nuclei (blue) were stained with DAPI. One-way ANOVA, ##p < 0.01, compared with control cells; $p < 0.05, $$p < 0.01, compared with IL-1β-treated cells.
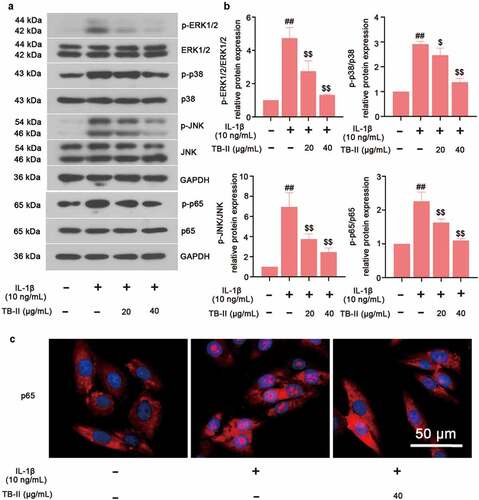
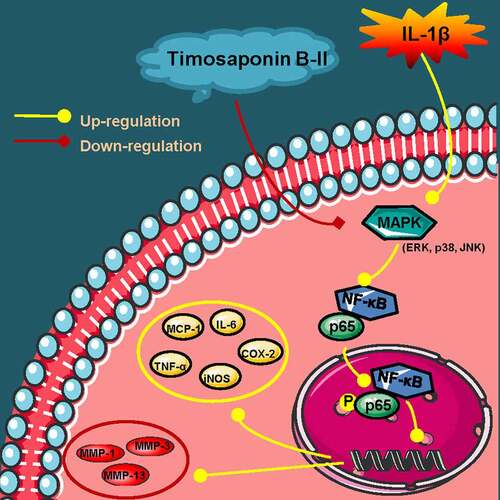
Figure 6. A schematic diagram of in vitro anti-OA effects of TB-II. Yellow arrows: A series of reactions of chondrosarcoma SW1353 cells stimulated by IL-1β. Red arrows: the mechanisms of TB-II in suppressing IL-1β-induced inflammation and ECM degradation in chondrosarcoma SW1353 cells. Yellow circle: inflammatory cytokines. Red circle: cartilage degrading enzymes.