
Figures & data
Table 1. qPCR primers
Figure 1. miR-135a-5p overexpression alleviated cardiac fibrosis of hypertensive mice. At 24 h before establishment of the hypertensive mouse model, mice were intramyocardially injected with miR-135a-5p agomir. (a): miR-135a-5p expression detected via RT-qPCR; (b): Blood pressure, including systolic blood pressure (SBP), diastolic blood pressure (DBP) and mean arterial pressure (MAP); (c): Basic cardiac function indexes; (d): Histopathological changes of cardiac tissues observed via H&E staining; (e): Cardiac fibrosis observed via Masson staining. N = 6, data were represented as mean ± SD. Data in figures A, C and E were analyzed using one-way ANOVA and data in figure B were analyzed using two-way ANOVA, followed by Tukey’s multiple comparison test. * P < 0.05.
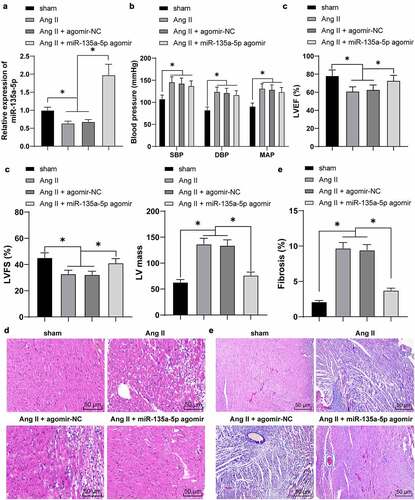
Figure 2. miR-135a-5p overexpression attenuated cardiac inflammation of hypertensive mice. a: NLRP3 expression in cardiac tissues detected via Western blot analysis; b-c: TNF-α and IL-6 levels in cardiac tissues determined via RT-qPCR and ELISA. N = 6, data were represented as mean ± SD. Data in figure A were analyzed using one-way ANOVA and data in figures b-c were analyzed using two-way ANOVA, followed by Tukey’s multiple comparison test. * P < 0.05.
Figure 3. miR-135a-5p overexpression suppressed Ang II–induced fibrosis and inflammation of CFs. Mouse CFs were treated with Ang II and then transfected with miR-135a-5p mimic. a-b: miR-135a-5p expression detected via RT-qPCR; C: NLRP3 expression determined via Western blot analysis; d-e: TNF-α and IL-6 levels measured via qRT-PCR and ELISA; f: COL-I and COL-III expression determined via ELISA; g: a-SMA level detected via immunofluorescence. Cell experiments were performed 3 times, and data were represented as mean ± SD. Data in figures a-b were analyzed using t test. Data in figures c and g were analyzed using one-way ANOVA. Data in figures B-C were analyzed using two-way ANOVA, followed by Tukey’s multiple comparison test. * P < 0.05.
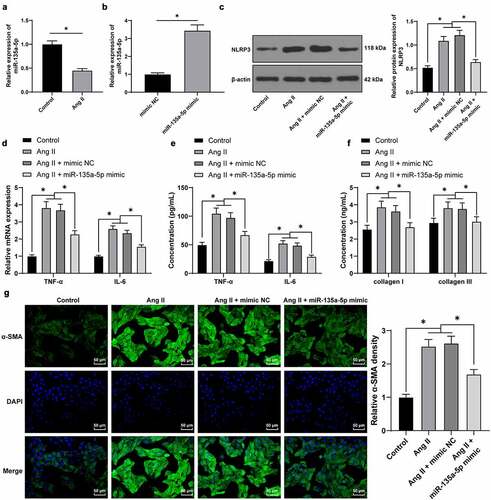
Figure 4. miR-135a-5p negatively regulated TXNIP. a: The targeting relationship of miR-135a-5p and TXNIP predicted via ENCORI: The Encyclopedia of RNA Interactomes. (sysu.edu.cn) website. b-c: The targeting relationship of miR-135a-5p and TXNIP testified via dual-luciferase reporter and RIP assays; d: TXNIP expression in cardiac tissues of hypertensive mice detected via RT-qPCR and Western blot analysis; f-g: TXNIP expression in mouse cardiac fibroblasts determined via RT-qPCR and Western blot analysis. Cell experiments were performed 3 times, and data were represented as mean ± SD. Data in figures A-B were analyzed using t test. Data in figures c and g were analyzed using one-way ANOVA. Data in figures a-b and d-g were analyzed using one-way ANOVA, and data in figure C were analyzed using followed by Tukey’s multiple comparison test. * P < 0.05.
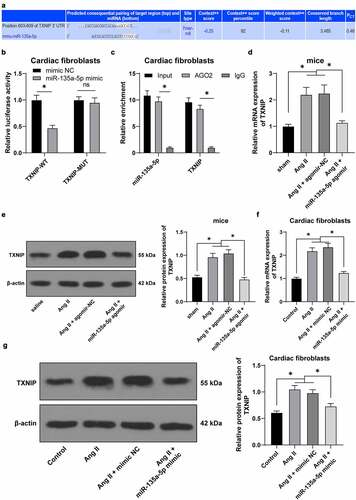
Figure 5. miR-135a-5p overexpression reduced the binding of TXNIP and NLRP3. a: Binding of TXNIP and NLRP3 in mouse CFs detected via Co-IP assay; b: Binding of TXNIP and NLRP3 upon transfection of miR-135a-5p mimic detected via Co-IP assay; c: TXNIP expression upon transfection of with oe-TXNIP determined via RT-qPCR; d: TXNIP expression detected upon transfection of miR-135a-5p mimic and oe-TXNIP via RT-qPCR and Western blot analysis; f: Interactive binding of TXNIP and NLRP3 detected via Co-IP assay. Cell experiments were performed 3 times and data were represented as mean ± SD. Data in figure C were analyzed using t test. Data in figures D-E were analyzed using one-way ANOVA, followed by Tukey’s multiple comparison test. * P < 0.05.
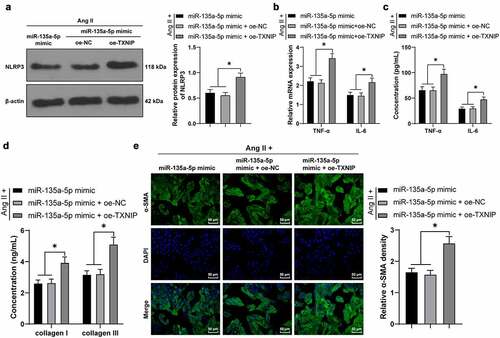
Figure 6. miR-135a-5p overexpression targeted TXNIP to suppress NLRP3-mediated inflammation and fibrosis of CFs. Ang II-treated mouse CFs were simultaneously transfected with miR-135a-5p mimic and oe-TXNIP. a: NLRP3 expression detected via Western blot analysis; b-c: TNF-α and IL-6 concentrations measured via RT-qPCR and ELISA; d: COL-I and COL-III expressions detected via ELISA; e: a-SMA expression detected via immunofluorescence. Cell experiments were performed 3 times and data were represented as mean ± SD. Data in figures a and e were analyzed using one-way ANOVA and data in figures b-d were analyzed using two-way ANOVA, followed by Tukey’s multiple comparison test. * P < 0.05.
Supplemental Material
Download Zip (514 KB)Data availability statement
The datasets used and analyzed during the current study are available from the corresponding author on reasonable request.