
Figures & data
Table 1. The primers used in this study
Figure 1. The expression of hsa_circ_0032683 in HCC. (a) Original data were downloaded from GEO database. (b) hsa_circ_0032683 was chosen from 8 downregulated circRNAs. (c)The Circbase and CSCD online tools were used to predict the ring formation characteristics of hsa_circ_0032683. (d) Relative hsa_circ_0032683 expression of 40 HCC patients’ tissues. (e) Relative hsa_circ_0032683 expression of HCC cell lines and WRL68. (f) HCC patients with high expression of hsa_circ_0032683 have a better prognosis. (g) After RNase R treatment, hsa_circ_0032683 expression level and NEK9 mRNA expression. (h) Immunofluorescence localization of hsa_circ_0032683. Data are expressed as the mean ± SD, *P < 0.05, **P < 0.01, ***P < 0.001.
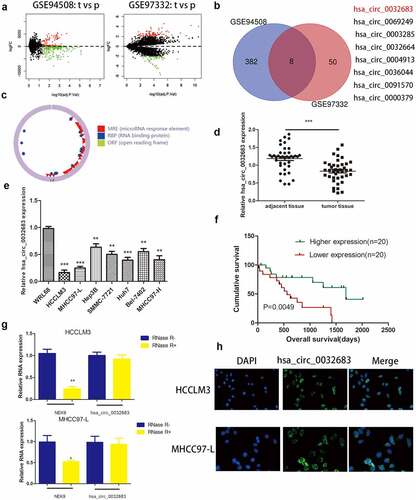
Table 2. Expression of hsa_circ_0032683 according to patients’ clinical features
Figure 2. Up-regulation of hsa_circ_0032683 suppressed cell proliferation and promoted apoptosis. (a) The expression levels of hsa_circ_0032683 in HCCLM3 and MHCC97-L cells transfected with OE- hsa_circ_0032683. (b) hsa_circ_0032683 overexpression inhibited colony formation of HCC cells. (c) The proliferation capacities of HCCLM3 and MHCC97-L cells transfected with OE- hsa_circ_0032683 were detected by CCK-8 assays. (d) Up-regulation of hsa_circ_0032683 inhibited cell growth of HCCLM3 and MHCC97-L cells by Edu assay. (e) hsa_circ_0032683 could promoted cell apoptosis by flow cytometry. Data are expressed as the mean ± SD, *P < 0.05, **P < 0.01, ***P < 0.001.
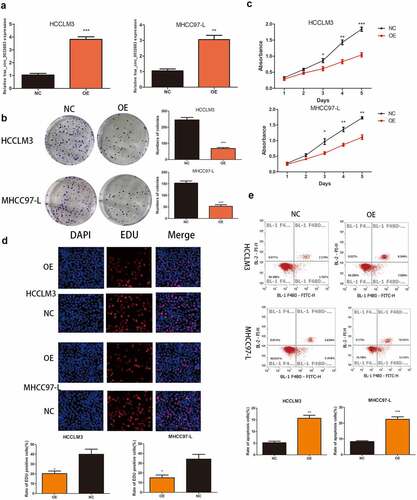
Figure 3. Hsa_circ_0032683 may act as the miR-338-5p sponge. (a) Potential targets were screened out through CSCD and CRI. (b) The schematic diagram of the binding sites between miR-338-5p and hsa_circ_0032683. (c) The relative luciferase activity detected by the dual-luciferase reporter assay. (d) Relative miR-338-5p expression of 40 HCC patients’ tissues. (e) Relative miR-338-5p expression of HCC cell lines and WRL68. (f) miR-338-5p expression level in HCCLM3 and MHCC97-L cells after transfected with OE- hsa_circ_0032683 or NC. (g) miR-338-5p expression level in transfected HCCLM3 and MHCC97-L cells. (H) Overexpression of miR-338-5p accelerated cell growth by CCK-8 assay. (I) Overexpression of miR-338-5p inhibited cell apoptosis by flow cytometry. Data are expressed as the mean ± SD, *P < 0.05, **P < 0.01, ***P < 0.001.
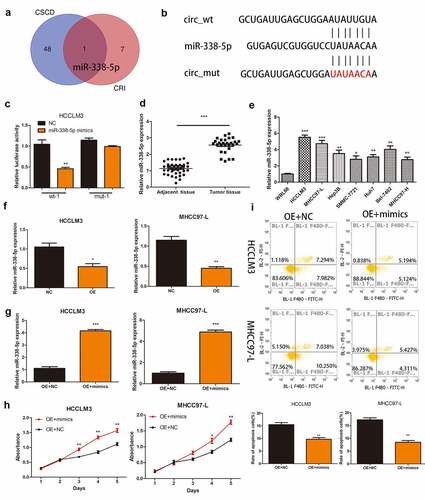
Figure 4. RTN4 may be a potential target of miR-338-5p. (a) Potential targets were screened out through miRTarBase, miRWalk, Targetscan and miRDB. (b) The expression of CSMD1, RTN4 and Tob1 were verified through TCGA databases and 40 pairs of HCC tissues collected. The last picture shows the relative expression of RTN4 in HCC tissues of hsa_circ_0032683 high expression group and hsa_circ_0032683 low expression group. (c) The relative luciferase activity detected by the dual-luciferase reporter assay. (d) RTN4 mRNA and protein expression in HCCLM3 and MHCC97-L cells transfected with OE- hsa_circ_0032683. (e) RTN4 mRNA and protein expression in HCCLM3 and MHCC97-L cells transfected with OE- miR-338-5p. Data are expressed as the mean ± SD, *P < 0.05, **P < 0.01, ***P < 0.001.
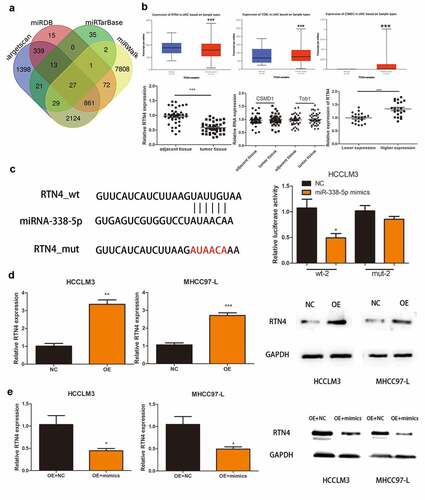
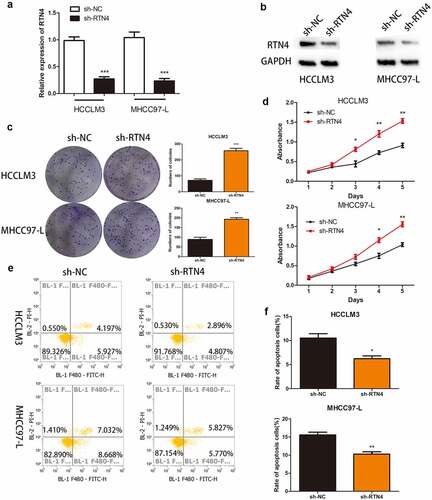
Figure 5. The effect of RTN4 on proliferation and apoptosis in hsa_circ_0032683 overexpressed HCC cells. (a) The level of RTN4 mRNA was measured by qRT-PCR in HCCLM3 and MHCC97-L cells after treating with shRNA against RTN4. (b) Western blotting was performed to measure the RTN4 protein level. (c and d) Knockdown of RTN4 in hsa_circ_0032683 overexpressed HCC cells accelerated colony formation and growth of HCC cells. (e and f) Knockdown of RTN4 in hsa_circ_0032683 overexpressed HCC cells inhibited cell apoptosis of HCCLM3 and MHCC97-L cells by flow cytometry. Data are expressed as the mean ± SD, *P < 0.05, **P < 0.01, ***P < 0.001.
Supplemental Material
Download Zip (3.7 MB)Data availability statement
Publicly available datasets were analyzed in this study. This data can be found here: https://portal.gdc.cancer.gov. The two GEO datasets referenced are GSE94508 and GSE97332