Figures & data
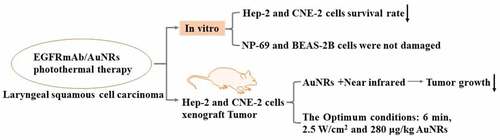
Figure 1. EGFRmAb-AuNRs inhibited the proliferation of laryngeal squamous cell carcinoma cells. (a)The morphology of Hep-2, CNE-2, NP-69 and BEAS-2B cells under a microscope. (b) The cell viability was measured by MTT after treatment with EGFRmAb-AuNRs and near-infrared laser irradiation for 24 h, 48 h and 72 h. (a) Hep-2 cells (b) CNE-2 cells. (c) The cell viability was measured by MTT after treatment with EGFRmAb-AuNRs and near-infrared laser irradiation for 24 h, 48 h and 72 h.(a) Hep-2 cells (b) CNE-2 cells. (d) The cell viability was measured by MTT after treatment with EGFRmAb-AuNRs and near-infrared laser irradiation for 24 h, 48 h and 72 h.(a) NP-69 cells (b) BEAS-2b cells. (e) The cell survival rates of Hep-2, BEAS-2B, CNE-2 and NP-69 were measured by CCK-8. Data were expressed as mean ± SD. *P < 0.05, **P < 0.01, ***P < 0.001.
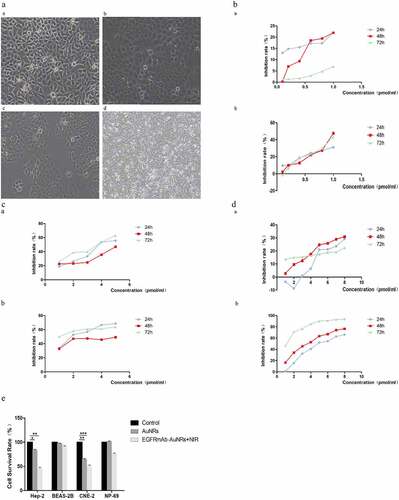
Figure 2. EGFRmAb-AuNRs conjugation increased laryngeal squamous cell carcinoma cancer cell apoptosis. The entry of EGFRmAb-AuNRs into Hep-2, CNE-2, BEAS-2B and NP-69 cells was observed under electron microscopy.
Figure 3. AuNRs with near-infrared photothermal therapy effectively reduced laryngeal squamous cell carcinoma tumor growth in nude mice. The growth curve of the tumors was measured every two days after treatment. (a) Hep-2 transplanted tumor in nude mice (b) CNE-2 transplanted tumor in nude mice.
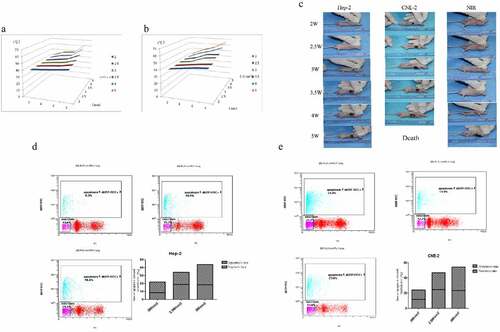
Table 1. Weight of Hep-2 tumor-bearing mice and tumor volume before treatment
Table 2. Weight of CNE-2 tumor-bearing mice and tumor volume before treatment
Figure 4. Improved survival of laryngeal squamous cell carcinoma transplanted mice after photothermal treatment with EGFR-AuNRs. (a and b) Kaplan-Meier survival curves of nude mice after treatment with EGFRmAb.iv, EGFRmAb-AuNRs.iv+NIR,0.9% saline.it, AuNRs.it +NIR and AuNRs.iv+NIR. (c and d) The weight of the nude mice in each group.
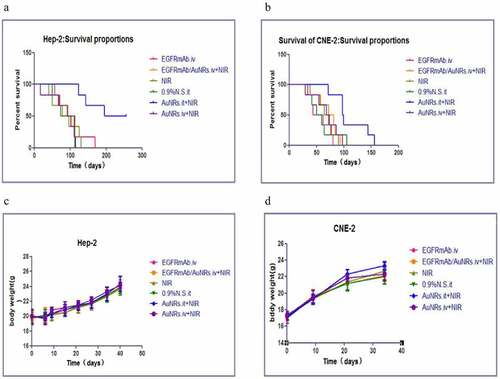
Figure 5. Optimizing near-infrared irradiation power and single irradiation time. (a) The relationship between the surface temperature of Hep-2 tumor and irradiation power and irradiation time. (b) The relationship between the surface temperature of CNE-2 tumor and irradiation power and irradiation time. (c-e) The ratio of apoptotic/necrosis of Hep-2 nude mice and CNE-2 nude mice. *P < 0.05 vs 2 W/cm2 group.
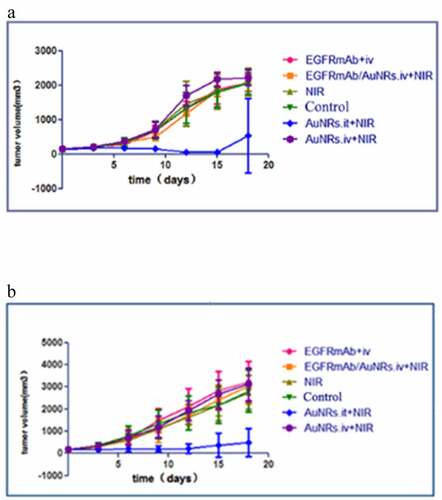
Figure 6. Dose optimization of intra-tumoral injection. (a and c) Tumor inhibition after 48 hours, 1 week and 2 weeks of photothermal therapy with different concentrations of AuNRs. (b and d) TUNEL and flow cytometry of apoptosis of tumor at 48 h, 1 week and 2 weeks after treatment. *P < 0.05, **P < 0.01 vs 187 μg/mL group.