
Figures & data
Figure 1. Fitting of the Log(r) to the Log(vg) model at each temperature.
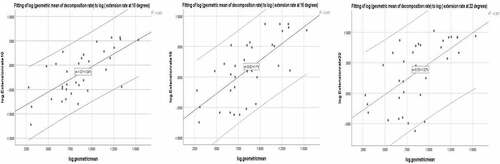
Figure 2. Scatter plot and heat map of fungal water niche width and growth rate under ideal conditions.
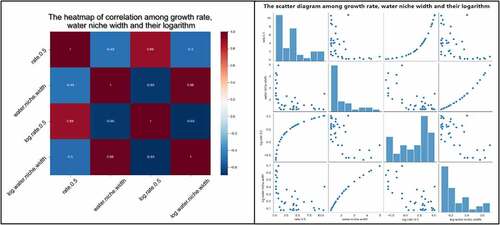
Figure 3. Nonlinear growth rate – moisture tolerance fitting model.
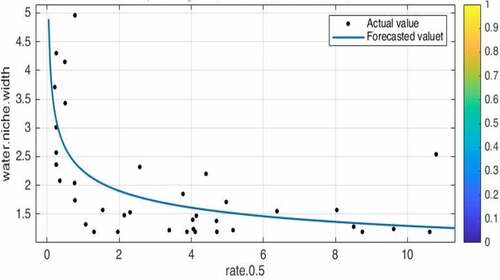
Table 1. Data of five different species of fungi
Figure 4. Length change curves of different species of fungi L-t relationship.
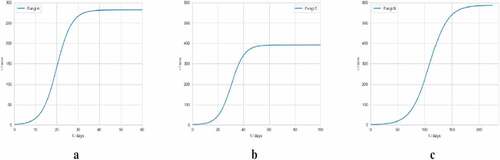
Figure 5. Variation curve of degradation speed of various species of fungi (r-t relationship).
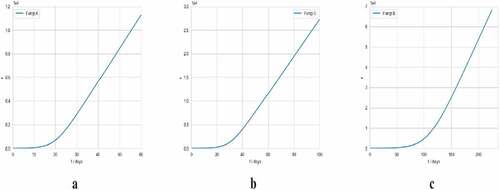
Figure 6. Mixed growth curve of fungus A and fungus B.
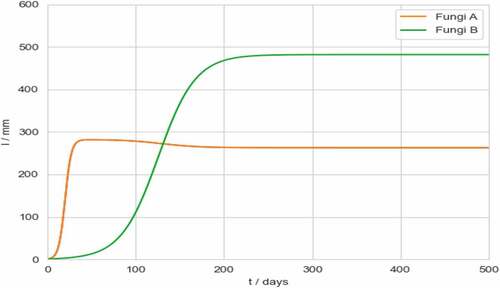
Figure 7. Fungus A and Fungus B respectively and co-decomposition rate.
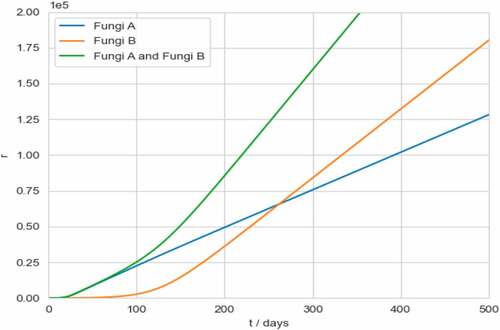
Table 2. Ambient relative humidity for various climate types
Table 3. Ambient relative humidity for various climate types
Figure 8. Decomposition rates of multiple fungal combinations at different humidity levels.
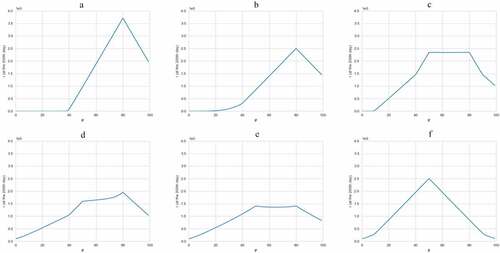
Figure 9. Fungi 1 and Fungi 2 growth curves with limited resources under ideal conditions.
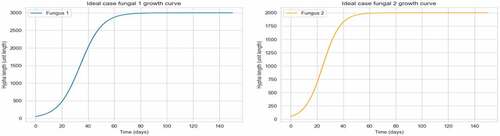
Figure 10. Ideally two fungi competing growth curves.
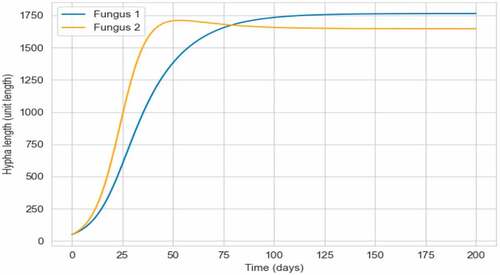
Figure 11. Competitive growth curves of two fungi at different ambient humidity.
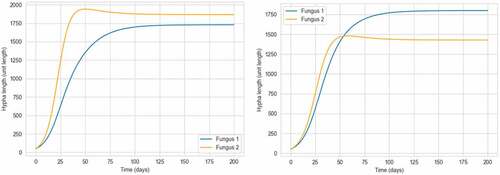
Figure 12. Growth curves of mono-fungi with environmental perturbations applied.
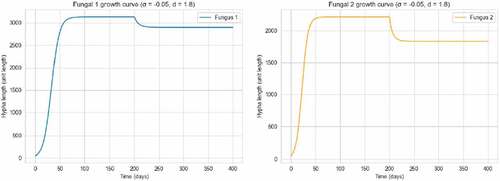
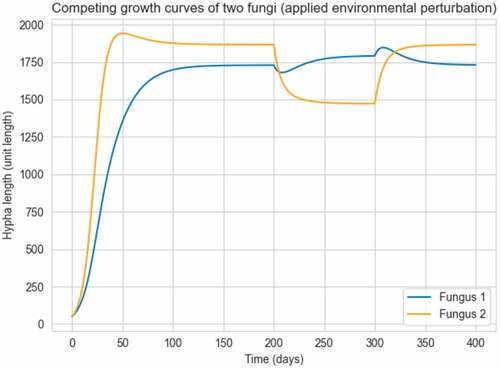
Figure 13. Growth curves of two-fungal systems in the presence of environmental disturbance.
Data availability statement
The data used to support this study are available from the corresponding author on reasonable request.