Figures & data
Figure 1. BARX2 is reduced in NPC tissues. (a-b) 586 and 73 differentially expressed genes were obtained by screening in GSE61218 (a) and GSE126683 (b) databases, respectively. (c) 13 differentially expressed genes were found in the intersection of two databases by Venn diagram. (d) expression of BARX2 in various tumor tissues from GEPIA database. (e) expression of BARX2 in collected NPC tissues and their adjacent tissues by RT-qPCR. (f) BARX2 expression in the collected NPC tissues and their adjacent tissues examined using immunohistochemical staining. (g) expression of BARX2 in normal nasopharyngeal epithelial cells NP69 and NPC cells CNE1, C666-1, HNE1, HNE3 by RT-qPCR. (h) BARX2 protein expression in normal nasopharyngeal epithelial cells NP69 and NPC cell lines CNE1, C666-1, HNE1, HNE3 examined using Western blot. Results are shown as mean ± SD, and the data were represented by three independent experiments. The paired t-test and one-way ANOVA was utilized for statistical analysis. *p < 0.05 vs adjacent tissues or NP69 cells.
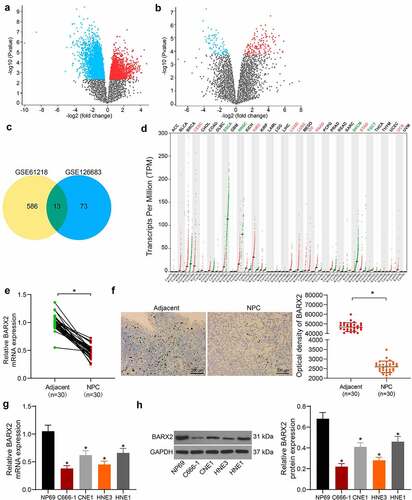
Figure 2. Ectopic expression of BARX2 hinders the growth, migration, and invasion of NPC cells in vitro. (a) BARX2 mRNA expression in C666-1 and HNE3 by RT-qPCR. (b) BARX2 protein expression in C666-1 and HNE3 by Western blot. (c) cell proliferative activity after BARX2 overexpression examined using CCK8. (d) expression of proliferation marker proteins Ki67 and PCNA after overexpression of BARX2 examined using Western blot. (e) cell migratory ability after overexpression of BARX2 measured using wound healing assay. (f) cell invasive activity after overexpression of BARX2 measured using Transwell assays. (g) cell apoptosis after overexpression of BARX2 examined using flow cytometry. (h) apoptosis rate of cells after overexpression of BARX2 examined using TUNEL. Results are shown as mean ± SD, and the data were represented by three independent experiments. The two-way ANOVA was utilized for statistical analysis. **p< 0.01, ***p< 0.001 vs oe-NC.
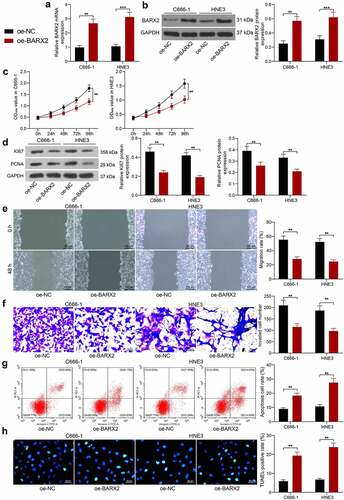
Figure 3. BARX2 represses the expression of KRT16 at the transcription level. (a) conserved binding sites for BARX2. (b) potential binding sites of KRT16 promoter to BARX2. (c) KRT16 expression in NPC patients queried in GEPIA. (d) the effect of BARX2 inhibition on Promoter luciferase activity examined using dual-luciferase assay. (e) the enrichment ability of anti-BARX2 on KRT16 promoter sequence measured using ChIP assay. (f-g) mRNA (f) and protein (g) expression of KRT16 in C666-1 and HNE3 cells overexpressing BARX2 by RT-qPCR and Western blot. Results are shown as mean ± SD, and the data were represented by three independent experiments. The two-way ANOVA was utilized for statistical analysis. *p < 0.05, **p< 0.01, ***p< 0.001 vs blank, oe-NC, or anti-IgG.
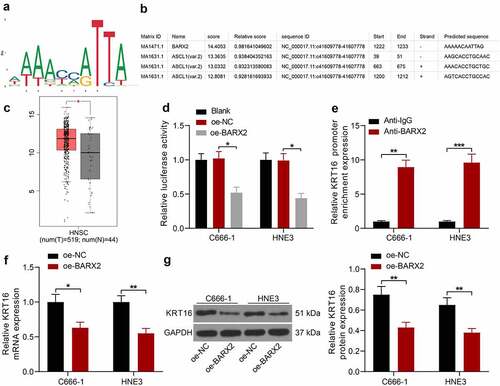
Figure 4. BARX2 inhibits the Ras signaling by suppressing the expression of KRT16. (a) genes with correlation coefficients larger than 0.5 with KRT16 in the TCGA database analyzed using KEGG enrichment analysis. (b) KEGG enrichment analysis of downstream proteins. (c) expression of BARX2 and KRT16 in NP69, C666-1 and HNE3 cells by RT-qPCR. (d) protein expression of BARX2, KRT16, pMEK1, MEK1, p-ERK1/2 and ERK1/2 in C666-1 and HNE3 cells examined using Western blot. (e) Immunohistochemical detection of KRT16, p-MEK1, and p-ERK1/2 expression in tissues of patients with NPC (n = 30). (f) Correlation between the expression of KRT16, p-MEK1, p-ERK1/2 and BARX2 in NPC tissues. Results are shown as mean ± SD, and the data were represented by three independent experiments. Unpaired t test or the two-way ANOVA was utilized for statistical analysis. **p< 0.01, ***p< 0.001 vs NP69 cells or adjacent tissues; #p< 0.05, ##p< 0.01, or &p< 0.05, &&p< 0.01 vs NC.
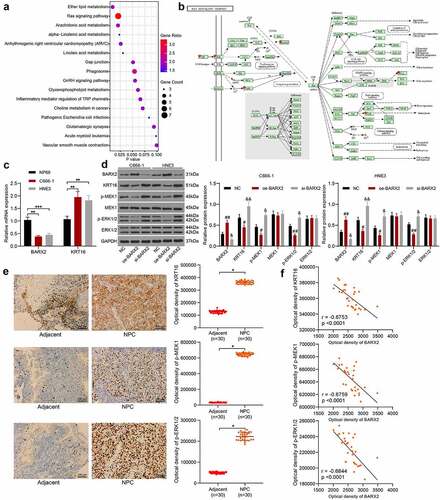
Figure 5. Upregulation of KRT16 significantly inhibits the role of oe-BARX2 on the malignant biological behavior of NPC cells. Overexpression of KRT16 was transfected into C666-1 and HNE3 cells overexpressing BARX2. (a) mRNA expression of KRT16 in cells by RT-qPCR. (b) cell proliferative activity examined using CCK8. (c) cell migratory ability measured using wound healing assay. (d) cell invasive activity measured using Transwell assays. (e) cell apoptosis examined using flow cytometry. (f) cell apoptosis rate examined using TUNEL. (g) protein expression of pMEK1, MEK1, p-ERK1/2 and ERK1/2 in cells after overexpression of KRT16 examined using Western blot. Results are shown as mean ± SD, and the data were represented by three independent experiments. The two-way ANOVA was utilized for statistical analysis. *p< 0.05, **p< 0.001 vs oe-BARX2 + oe-NC.
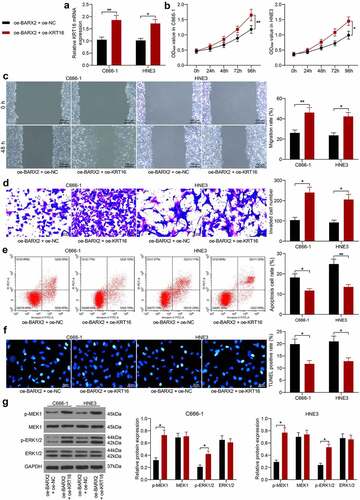
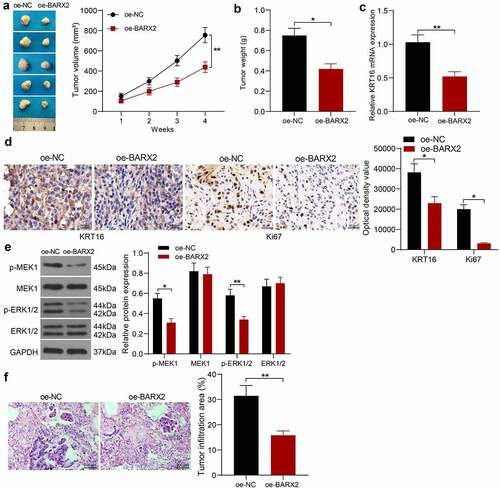
Figure 6. BARX2 impedes the growth and metastases of NPC cells in vivo. (a) changes in tumor volume in mice examined using in vivo tumorigenesis assay. (b) assessment of cellular tumorigenic capacity by tumor weight change. (c) mRNA expression of KRT16 in tumor tissues by RT-qPCR. (d) immunohistochemical analysis of KRT16 and ki67 in tumor tissues. (e) protein expression of pMEK1, MEK1, p-ERK1/2 and ERK1/2 in tumor tissues examined using Western blot. (f) lung infiltration of tumor cells examined using HE staining. Results are shown as mean ± SD (n = 5). The unpaired t-test and two-way ANOVA was utilized for statistical analysis. *p < 0.05, **p < 0.01 vs oe-NC.