Figures & data
Figure 1. TGF-β1 increased SREBP2 level and decreased ABCA1 level in ASMCs. Different concentrations of TGF-β1 (0, 0.5, 1, 5 and 10 ng/mL) were used to treat ASMCs. (a) Cell viability, the relative SREBP2 and ABCA1 (b) mRNA level and (c) expression level was detected by MTT assay, qRT-PCR, and Western blotting. # p < 0.05, ## p < 0.01; # compare with the 0 ng/mL TGF-β1 group.
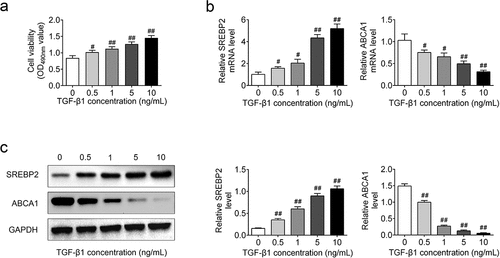
Figure 2. SREBP2 knockdown inhibited cell proliferation in ASMCs. shSREBP2 or shNC were transfected into ASMCs, or 5 ng/mL TGF-β1 were treated with ASMCs. (a) The relative SREBP2 and ABCA1 level, (b) cell viability, and (c) cell proliferation was detected by Western blotting, MTT assay and Brdu staining. ## p < 0.01; # compare with the control group. @ p < 0.05, @@ p < 0.01; @ compare with the TGF-β1 + shNC group.
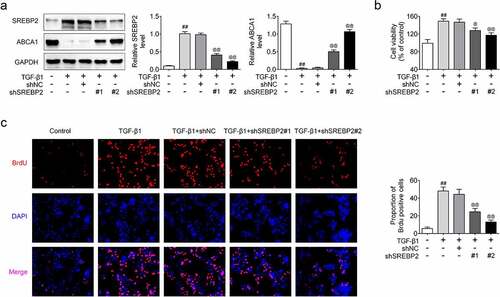
Figure 3. SREBP2 knockdown promoted apoptosis in ASMCs. shSREBP2 or shNC were transfected into ASMCs, or 5 ng/mL TGF-β1 was treated with ASMCs. (a) Apoptosis and (b) apoptosis-related proteins, caspase-3 and cleaved PARP levels were detected by flow cytometer and Western blotting. # p < 0.05, ## p < 0.01; # compare with the control group. @ p < 0.05, @@ p < 0.01; @ compare with the TGF-β1 + shNC group.
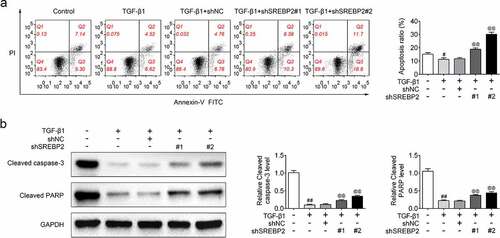
Figure 4. SREBP2 knockdown inhibited cell migration in ASMCs. shSREBP2 or shNC was transfected into ASMCs, or 5 ng/mL TGF-β1 was treated with ASMCs. (a) Cell migration and (b) migration-related proteins, E-cad and vimentin levels were detected by Transwell assay and Western blotting. # p < 0.05, ## p < 0.01; # compare with the control group. @ p < 0.05, @@ p < 0.01; @ compare with the TGF-β1 + shNC group.
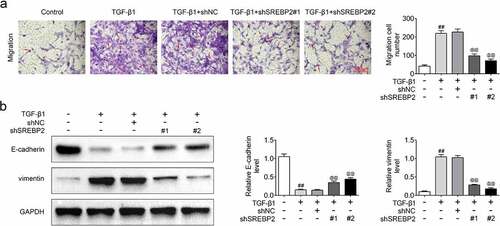
Figure 5. SREBP2 promoted cell viability, migration, and inhibited apoptosis in ASMCs. SREBP2 vector or empty vector were transfected into ASMCs, or 5 ng/mL TGF-β1 was treated with ASMCs. (a) Cell viability, (b) apoptosis and (c) cell migration were detected by MTT assay, flow cytometer and Transwell assay. # p < 0.05, ## p < 0.01; # compare with the control group. @ p < 0.05, @@ p < 0.01; @ compare with the TGF-β1 + shNC group.
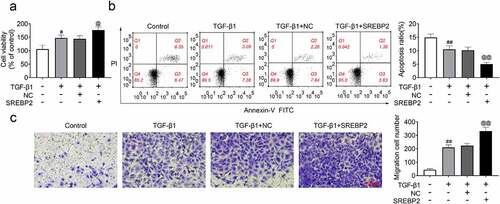
Figure 6. SREBP2 activated the TLR2/NF-κB/NFATc1 pathway by inhibiting the expression of ABCA1. shSREBP2, SREBP2 vector or ABCA1 vector were transfected into ASMCs, or 5 ng/mL TGF-β1 was treated with ASMCs. (a) The level of ABCA1, TLR2, p-p65, p65 and NFATc1, and (b) SREBP2, ABCA1, TLR2, p-p65, p65 and NFATc1 were detected by Western blotting. ## p < 0.01; # compare with the control group. @ p < 0.05, @@ p < 0.01; @ compare with the TGF-β1 + shNC or SREBP2 group.
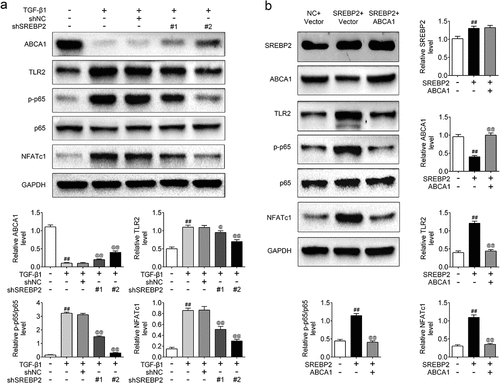
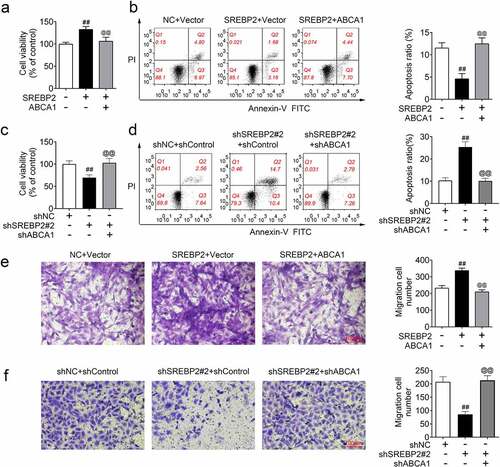
Figure 7. SREBP2 promoted TGF-β1-induced cell motility through regulating ABCA1 expression. shSREBP2, SREBP2 vector, shABCA1 or ABCA1 vector were transfected into ASMCs. (a and c) Cell viability, (b and d) apoptosis and (e and f) cell migration was detected by MTT assay, flow cytometer and Transwell assay. ## p < 0.01; # compare with the control group. @@ p < 0.01; @ compare with the SREBP2 group or the shSREBP2 group.