
Figures & data
Table 1. Correlation of MBNL1-AS1 expression with clinicopathological characteristics in BC patients
Figure 1. LncRNA MBNL1-AS1 was downregulated in breast cancer tissues and cell lines. (a) The heatmap of differentiated lncRNAs in breast cancer screened via TCGA database. (b) The bioinformatics prediction from TCGA database showed that MBNL1-AS1 showed lower expression levels in breast cancer tissues compared with normal tissues. C. Boxplot exhibits that MBNL1-AS1 in 60 cancer tissue samples was decreased compared with normal tissues. (d) MBNL1-AS1 level in five breast cancer cell lines (BT474, MDA-MB-231, MDA-MB-453, ZR-75-30, and MCF-7) was poorer than that in normal MCF-10A cells (MCF-7 showed the lowest level, and BT474 showed relatively high MBNL1-AS1 levels) by qRT-PCR; (e) Five-year survival of patients with high expression of MBNL1-AS1 was higher compared with patients with low expression of MBNL1-AS1.
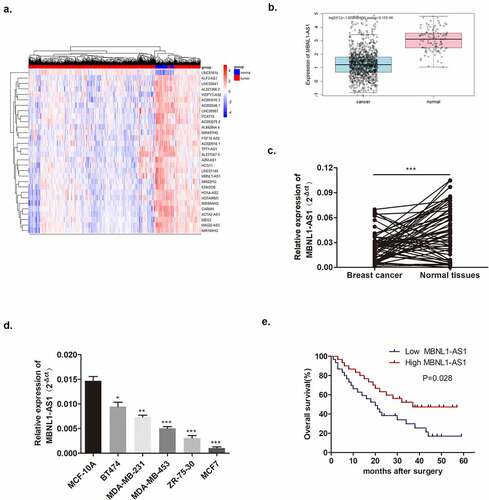
Figure 2. Increased MBNL1-AS1 expression could inhibit MCF-7 cell proliferation, migration, and invasion abilities. (a) Transfection efficiency by NC and MBNL1-AS1 ov was determined by qRT-PCR. (b) Cell viability in the MBNL1-AS1 ov group was significantly decreased as observed in CCK-8 assay. (c) The colony formation ability in the MBNL1-AS1 ov group was much lower than that in the NC group. (d) Apoptosis by flow cytometry showed that the overexpression of MBNL1-AS1 could notably promote the apoptosis rate in breast cancer. Cell migration (e) and invasion (f) ability in the MBNL1-AS1 ov group were conspicuously decreased compared with those in the NC group. (g) Wound healing assay further verified the attenuated migration in the MBNL1-AS1 ov group. NC, negative control, with MCF-7 cells transfected with blank plasmid; MBNL1-AS1 ov, MBNL1-AS1 overexpression, with MCF-7 cells transfected with MBNL1-AS1 overexpression plasmid. **p < 0.01, *p < 0.05.
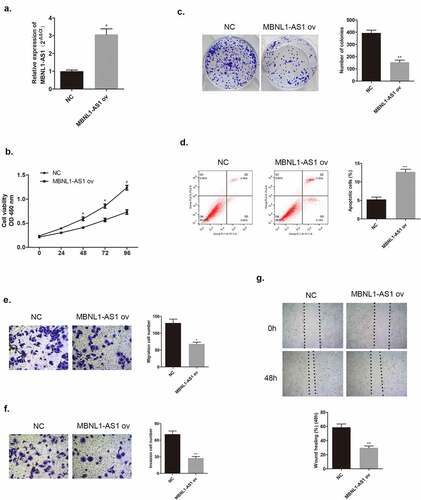
Figure 3. MBNL1-AS1 knockdown could promote BT474 cell proliferation, invasion, and migration abilities. (a) MBNL1-AS1 knockdown system was constructed in BT474 cell line; qRT-PCR detected MBNL1-AS1 expression after transfection. (b) CCK-8 assay was applied to evaluate proliferation. (c) Colony formation experiment was performed to determine the ability of clone formation. (d) Apoptosis determined by flow cytometry. (E & F) Transwell migration and invasion assays were conducted and results showed that MBNL1-AS1silencing would elevate both migration and invasion. (g) Wound healing assay further indicated that MBNL1-AS1 knockdown potentiated cell migration. si-NC, negative control of siRNA, with BT474 cells transfected with negative control of siRNA; si-MBNL1-AS1, siRNA of MBNL1-AS1, with BT474 cells transfected with siRNA of MBNL1-AS1. **p < 0.01, *p < 0.05.
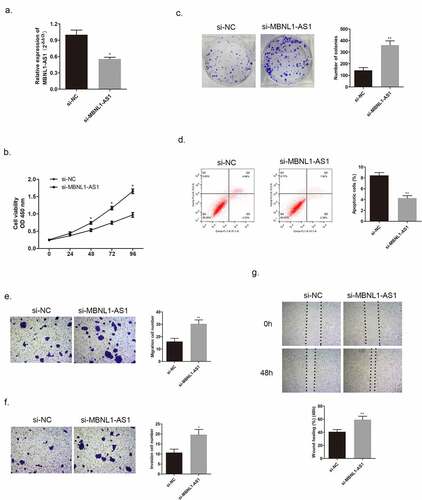
Figure 4. MBNL1-AS1 suppressed tumor formation and growth in vivo. (a&b) Tumor images of MBNL1-AS1 overexpression and MBNL1-AS1 knockdown groups. (c&d) Average tumor volume in MBNL1-AS1 ov group escalated slowly, whereas that in the MBNL1-AS1 silencing group showed a higher growth rate when compared with the NC group. (e&f) The weight of tumors in nude mice; MBNL1-AS1 overexpression could inhibit tumor growth, whereas MBNL1-AS1 knockdown facilitated tumor development. NC, negative control, with MCF-7 cells transfected with blank plasmid; MBNL1-AS1 ov, MBNL1-AS1 overexpression, with MCF-7 cells transfected with MBNL1-AS1 overexpression plasmid. Si-NC, negative control of siRNA, with BT474 cells transfected with negative control of siRNA; si-MBNL1-AS1, siRNA of MBNL1-AS1, with BT474 cells transfected with siRNA of MBNL1-AS1. **p < 0.01, *p < 0.05.
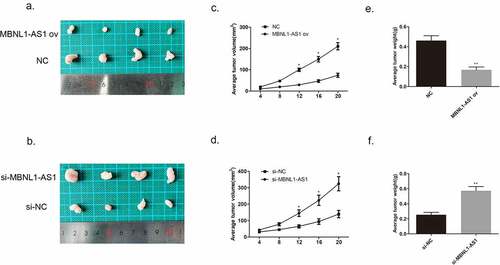
Figure 5. MBNL1-AS1 targeted miR-423-5p with negative regulation. (a) Bioinformatics prediction presented the binding sites between MBNL1-AS1 and miR-423-5p. (b) Dual luciferase reporter assay verified a direct interaction between MBNL1-AS1 and miR-423-5p. (c) The expression of miR-423-5p in 60 breast cancer patient tissue samples was higher than that in normal tissue samples. ***p < 0.001, **p < 0.01, *p < 0.05.
Figure 6. MiR-423-5p reversed the inhibitory effect of MBNL1-AS1 on MCF-7 cell promotion. (a) MiR-423-5p expression in the three groups after transfection detected by qRT-PCR (b) Cell viability evaluated by the CCK-8 assay. (c) Colony formation experiment identified the ability of clone formation. (d) Apoptosis ability assessed by flow cytometry. The abilities of migration (e) and invasion (f) were determined by transwell assay. (g) Wound healing assay was performed to describe migration capacity. NC, negative control, with MCF-7 cells transfected with blank plasmid; MBNL1-AS1 ov, MBNL1-AS1 overexpression, with MCF-7 cells transfected with MBNL1-AS1 overexpression plasmid; MBNL1-AS1 ov + miR-422-5p mimics, with MCF-7 cells transfected with MBNL1-AS1 overexpression plasmid and miR-422-5p mimics.
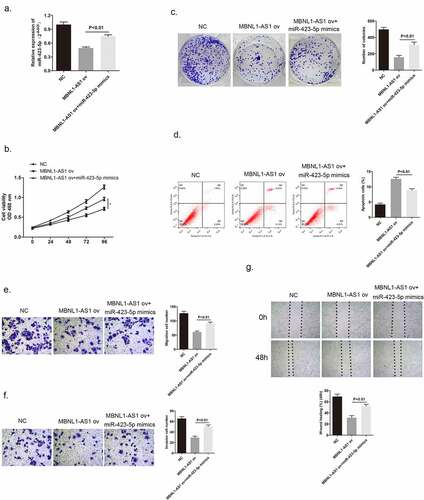
Figure 7. MiR-423-5p targeted CREBZF with a negative relationship. (a) Complementary sequence of miR-423-5p and CREBZF 3′UTR. (b) Dual luciferase reported assay experiment. (c) CREBZF mRNA levels in 60 tissue samples were lower than those in normal tissue samples via qRT-PCR. (d) CREBZF protein in eight pairs of selected tissue samples was poorly expressed compared with that in adjacent tissues by Western blotting.
Figure 8. CREBZF knockdown reversed the effect of down-regulated miR-423-5p level on MCF-7 cells, and facilitated cancer cell development. (a) CREBZF mRNA level in the three groups after transfection as detected by qRT-PCR. (b) CCK-8 assay evaluated cell viability. (c) Colony formation assay identified the ability of clone formation. (d) Apoptosis ability accessed by flow cytometry. (E&F) The ability of migration and invasion was determined by transwell assay. (g) Wound healing assay was performed to describe migration capacity. Inhibitor NC, inhibitor negative control, with MCF-7 cells transfected with inhibitor NC plasmid; miR-422-5p inhi., miR-422-5p inhibitor, with MCF-7 cells transfected with miR-422-5p inhibitor plasmid; miR-422-5p inhi. + si-CREBZF, miR-422-5p inhibitor + siRNA of CREBZF, with MCF-7 cells transfected with miR-422-5p inhibitor plasmid and siRNA of CREBZF plasmid.
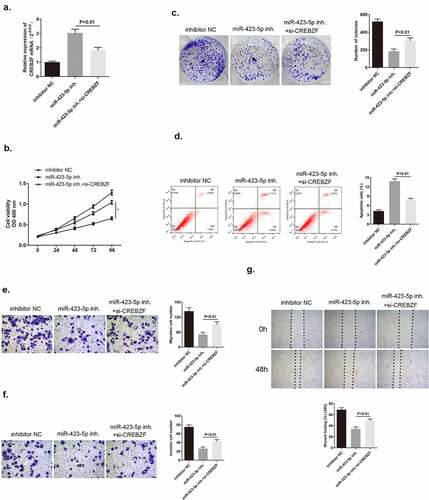
Figure 9. Western blotting results showed that MBNL1-AS1 affected PI3K/Akt pathway-related proteins through CREBZF. The phosphorylation of PI3K and Akt was changed, whereas the total PI3K and Akt remained the same, and further affected apoptosis pathway-related protein (Bcl-2), proliferation pathway-related protein (CyclinD1), and EMT pathway-related protein (Vimentin). NC, negative control, with MCF-7 cells transfected with blank plasmid; MBNL1-AS1 ov, MBNL1-AS1 overexpression, with MCF-7 cells transfected with MBNL1-AS1 overexpression plasmid; Si-NC, negative control of siRNA, with BT474 cells transfected with negative control of siRNA; si-MBNL1-AS1, siRNA of MBNL1-AS1, with BT474 cells transfected with siRNA of MBNL1-AS1.
Data availability statement
The data of this study could be requested from the corresponding authors ([email protected] or [email protected]).